North Carolina Employment Projections 2024 - 2034
Part 1: Statewide Projections
The North Carolina Department of Commerce has published 10-year industry and occupation employment projections for statewide and sub-state areas.1 The employment projections estimate future demand for workers based on historical employment data and a range of economic factors.2 They provide valuable information for policymakers, job seekers, training providers, and businesses, enabling informed workforce decisions and helping ensure that North Carolina’s workforce is prepared for tomorrow’s job opportunities and economic growth.
Key Highlights of the 2024-2034 Employment Projections:
- Industry Employment Projections
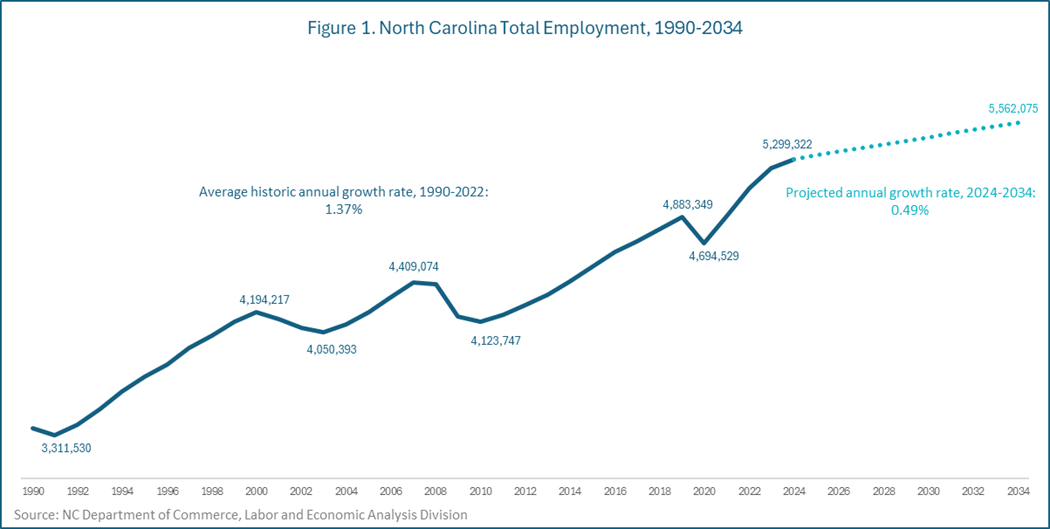
- North Carolina is projected to add more than 262,700 new jobs between 2024 and 2034 growing at an annual rate of 0.49%. In comparison, the U.S. economy is projected to grow at a rate of 0.30% annually over the same period.
- The Service-providing sector is projected to contribute 91% of all net new jobs created.
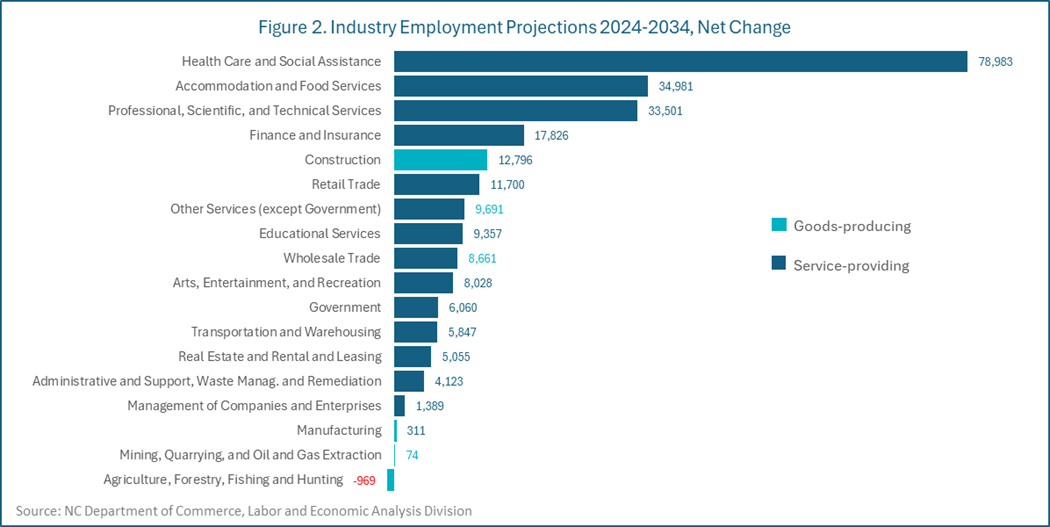
- Health Care and Social Assistance, the state’s largest industry by employment, is projected to add nearly 79,000 new jobs by 2034.
- Employment in Manufacturing industry is expected to remain nearly flat with only 300 jobs added over the next 10 years.
- Agriculture, Forestry, Fishing and Hunting is the only industry sector projected to lose jobs.
- Occupational Employment Projections
- North Carolina is projected to have over 599,500 job openings annually, comprising nearly 253,000 openings from exits3, 320,300 from transfers4, and almost 26,300 from economic growth.
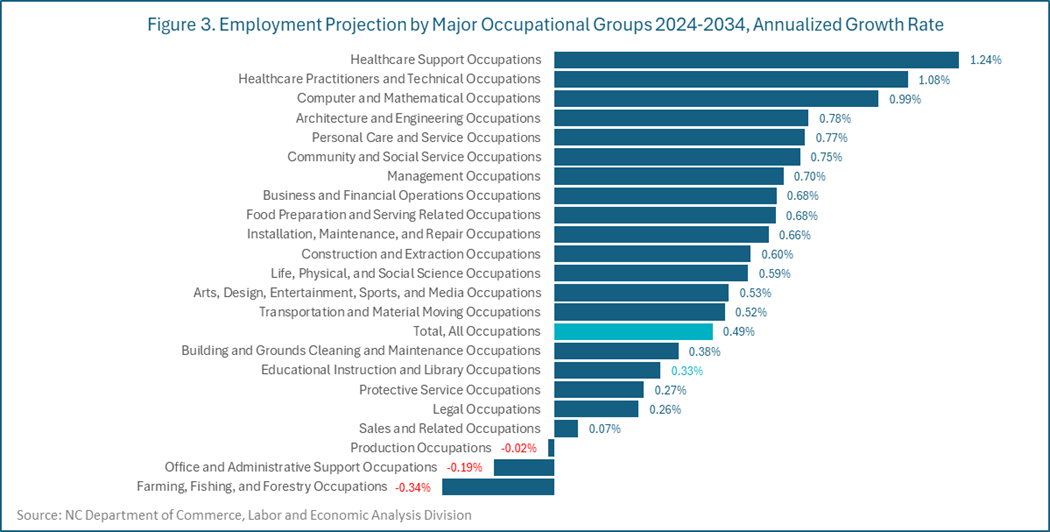
- Occupations in Healthcare Support, Healthcare Practitioners and Technical groups, and Computer and Mathematical Occupations are projected to be among the fastest growing jobs.
- Production Occupations are projected to lose jobs, although very modestly.
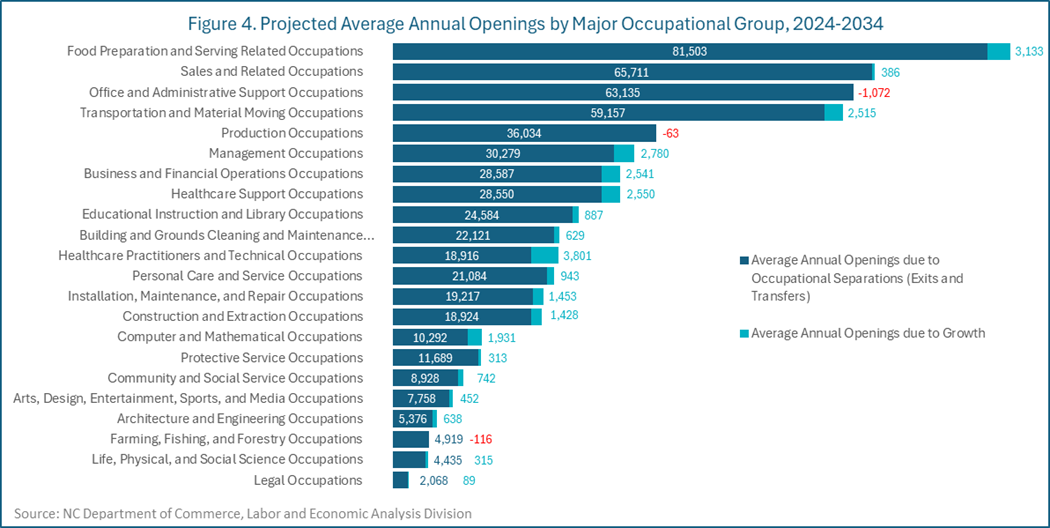
- Food Preparation and Serving Related Occupations and Sales and Related Occupations will have the largest turnover with 84,600 and 66,100 annual job openings, respectively.
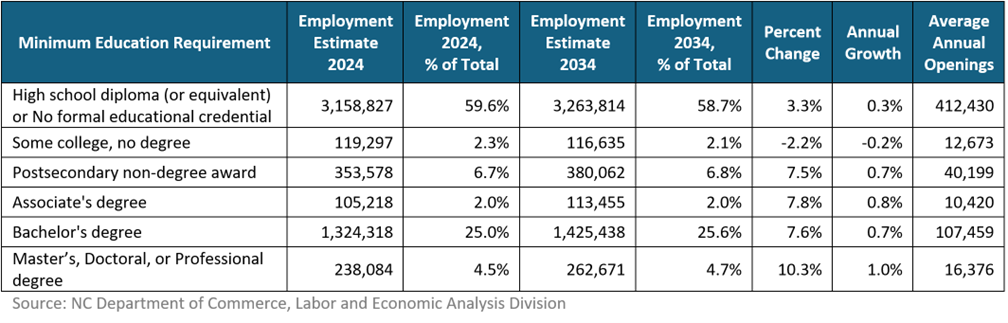
- The share of occupations requiring no formal educational or high school diploma is projected to decline from 59.6% to 58.7% statewide over the next 10 years; however, they are projected to generate the most job openings (68.8%), mostly due to high separation rates.
1. Total Employment
North Carolina employment is projected to add more than 262,700 new jobs between 2024 and 2034, growing annually at an average rate of 0.49%. Although this rate is lower than the 1.37% average annual growth observed over the past three decades (Figure 1), it is still higher than the projected national rate of 0.30%5 for the same period.
2. Industry employment
2.1 Service-Providing Industries
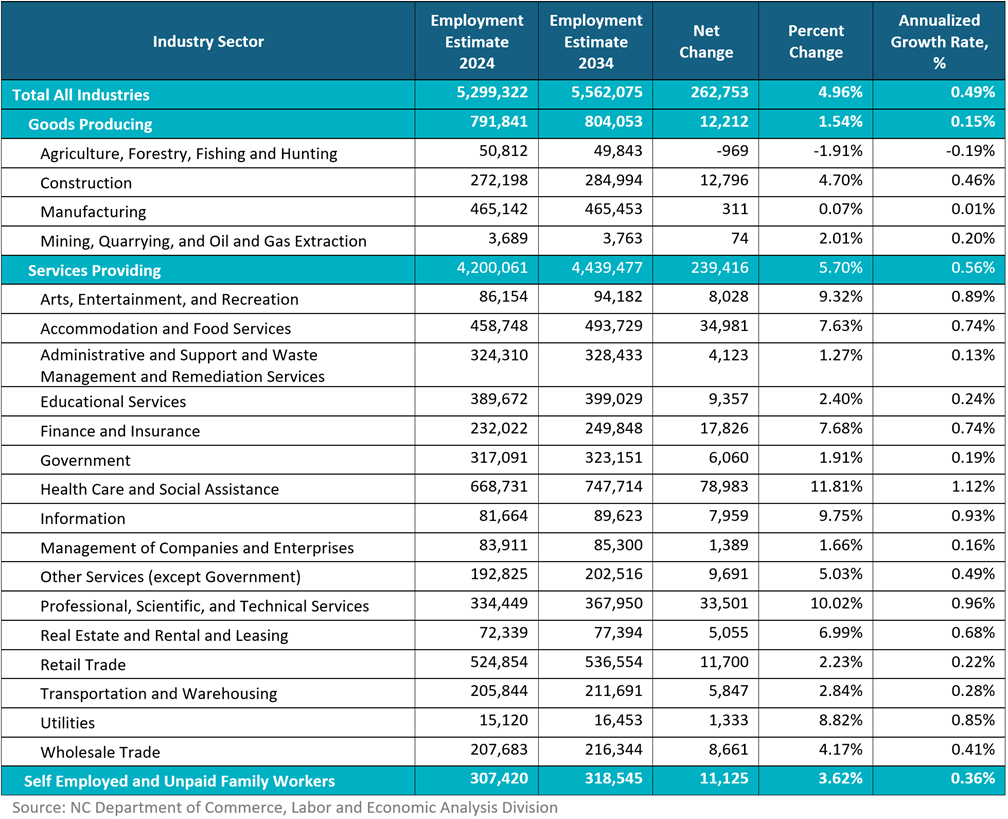
Similar to the national trends, Service-providing industries in North Carolina are projected to add more jobs than Goods-producing industries. This sector provided nearly 79% of the state’s total employment in 2024 and is expected to generate more than 239,400 new jobs by 2034 (Table 1).
Health Care and Social Assistance, the largest service sector by employment, is projected to be the fastest growing with an annualized growth rate of 1.12%, adding nearly 79,000 jobs overall (Figure 2). Almost half of this growth will be within Ambulatory Health Care Services, driven by increased demand for health care services by North Carolina’s aging population.6
The Professional, Scientific, and Technical Services sector is anticipated to be the second fastest-growing sector, with an annualized growth rate of 0.96%, adding 33,500 new jobs over the next decade (Figure 2). This sector has historically been strong and is critical to the state economy, particularly given its relatively high wages. This growth will be primarily driven by new jobs in the Computer Systems Design and Related Services industry.
The Finance and Insurance sector is projected to grow by 0.74% annually and add more than 17,800 jobs by 2034 – one of the highest gains among service industries, primarily driven by new jobs in the Credit Intermediation and Related Activities industry.
The Accommodation and Food Services sector is expected to add nearly 35,000 jobs by 2034, largely in the Food Services and Drinking Places industry.
Retail Trade, the second largest sector by employment, is projected to grow modestly by 0.22% annually, adding 11,700 new jobs. The Wholesale Trade sector is expected to grow by 0.41%, adding slightly more than 8,600 jobs.
The Educational Services sector is projected to grow at an annual rate of 0.24% and add over 9,300 jobs, driven by the growth in the Colleges/Universities/Professional Schools and the Elementary/Secondary Schools.
Table 1. North Carolina Industry Employment Projections, 2024-2034
2.2 Goods-Producing Industries
Compared to the Service-providing sector, the Goods-producing sector is expected to grow much more slowly. It is primarily driven by the Construction industry, which is projected to gain 4.70% in employment, adding nearly 12,800 jobs, reflecting North Carolina's population growth and housing demand.
In line with national trends, Manufacturing employment in North Carolina is projected to remain nearly flat, growing by 0.07% and adding only slightly more than 300 jobs by 2034. Significant job gains are expected in Machinery Manufacturing (+2,700), Food Manufacturing (+2,500), Chemical Manufacturing (+1,500), and Plastics and Rubber Products Manufacturing (+1,300). However, Furniture and Related Product Manufacturing (-3,100), Textile Mills (-2,500), and Apparel Manufacturing (-1,100) are projected to lose the most jobs.
Employment in the Agriculture, Forestry, Fishing and Hunting industry is expected to decrease (-969), driven by a decline in Animal Production and Aquaculture (-743), partially offset by a small gain in Crop Production (+438).
2.3 Self Employed and Unpaid Family Workers
Employment for Self-Employed and Unpaid Family Workers is projected to grow by 3.62% and reach more than 318,500 jobs by 2034. This growth reflects broader trends toward entrepreneurship and gig work, which represent an increasingly important part of North Carolina's economy, especially since the pandemic.
3. Occupational employment
3.1 Employment Growth
Table 2 shows occupational employment estimates for 2024-2034. The following five largest occupational groups in 2024 are projected to remain the largest in and together are expected to account for almost half of the total employment in 2034:
- Office and Administrative Support Occupations (Customer Service Representatives, Office Clerks, Secretaries and Administrative Assistants, etc.);
- Sales and Related Occupations (Cashiers, Salespersons, Sales Representatives, etc.) ;
- Transportation and Material Moving Occupations (Material Movers, Stockers and Order Fillers, Truck Drivers, etc.);
- Food Preparation and Serving Related Occupations (Cooks, Waiters and Waitresses, etc.);
- Management Occupations (various Managers, Administrators, and Directors).
All but one of these occupational groups are projected to gain jobs by 2034, with three experiencing significant expansion: Food Preparation and Serving Related Occupations (+31,300), Management Occupations (+27,800), and Transportation and Material Moving (+25,100), each increasing by 5-7%.
The largest occupational group, Office and Administrative Support Occupations, is projected to decrease by 1.83% and lose more than 10,700 jobs. This decrease is mostly driven by jobs losses in Customer Service Representatives (-4,200), Office Clerks (-4,150), and Bookkeeping, Accounting, and Auditing Clerks (-2,360). This decline will be somewhat offset by increases in Medical Secretaries and Administrative Assistants (+3,600) and Couriers and Messengers (1,250).
Growth in the second-largest occupational group – Sales and Related Occupations – is projected to be nearly flat at 0.74%, with slightly more than 3,860 jobs added over ten years.
Table 2. North Carolina Employment Projections by Major Occupational Group, 2024-2034
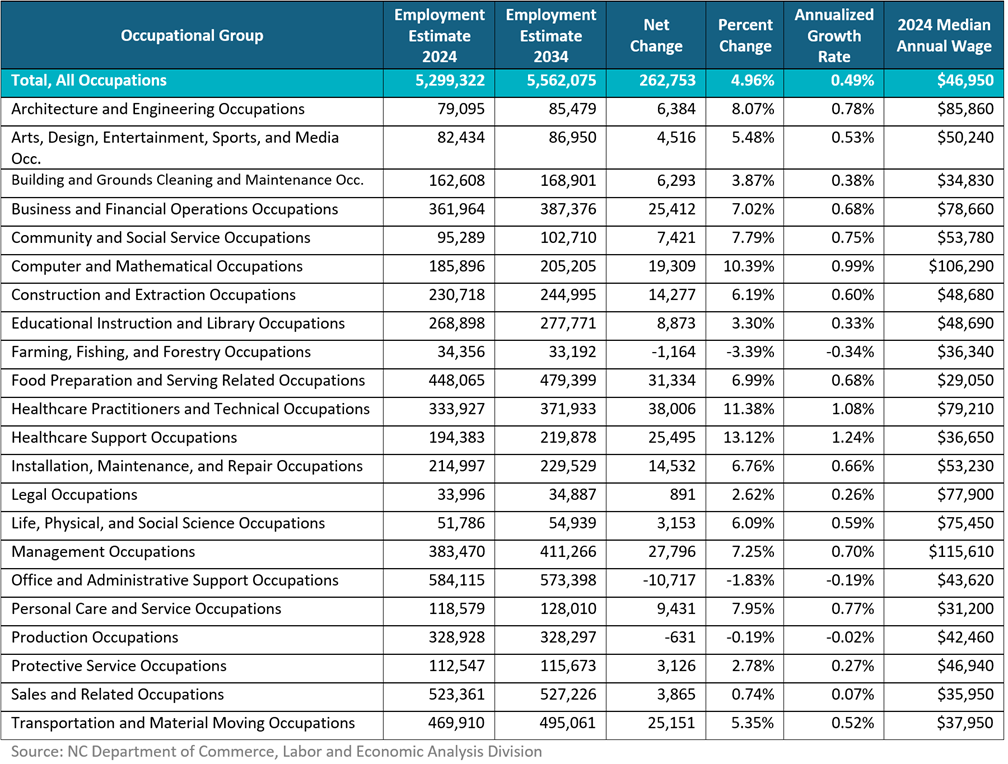
In relative terms, the fastest growing occupations are projected to be Healthcare Support Occupations (Healthcare Aides, Assistants, etc.) and Healthcare Practitioners and Technical Occupations (Doctors, Nurses, Technicians, etc.) are projected to add 25,500 (+13.12%) and 38,000 (+11.38%) jobs, respectively.
However, these two groups are separated by a significant wage gap – Healthcare Support Occupations have a median annual wage of $36,650, compared to $79,210 for Healthcare Practitioners and Technical Occupations, a difference of more than $42,000. This highlights the fact that the fastest-growing healthcare jobs are split between high-skill, high-pay roles and lower-wage support positions.
Other rapidly growing occupational groups include Computer & Mathematical Occupations (Software Developers, Data Scientists, Information Security Analysts) and Architecture and Engineering Occupations (Architects, Industrial Engineers, Mechanical Engineers, Civil Engineers) that are projected to grow by 10.39% and 8.07%, respectively.
Production Occupations are projected to decline by 2034, reflecting the overall slowing down in Manufacturing.
Farming, Fishing, and Forestry Occupations are also projected to lose jobs over the projected period.
The two highest-paid occupational groups – Management Occupations (at a median annual wage of $115,610) and Computer & Mathematical Occupations (with a median annual wage of $106,290) – are projected to grow by 7.25% and 10.39%, respectively. Together, these two groups, both paying well above the state median, are adding over 47,000 jobs.
In line with the growth of Finance and Insurance industry sector (Table 1), Business and Financial Operations Occupations are projected to grow significantly and add 25,400 jobs (+7.02%). These occupations are important as they represent a significant source of high-wage employment growth, with a median annual wage of $78,660.
Occupations at the highest ends of the wage scale will experience the fastest growth (Table 2). Jobs with median annual wages above the statewide 75th percentile ($72,480), are expected to grow by 8.5%, from 1.24 million to 1.35 million jobs between the 2024-2034 period.
In contrast, occupations with median annual wages below the statewide 25th percentile ($34,900) or between the 25th and 75th percentiles are expected to grow by only 3.9 and 3.8%, respectively.
Despite these stark wage differences, many high-growth occupations share a common trait: the dominance of non-routine tasks that are difficult to automate. However, jobs with a high degree of routine work, such as Production and Office/Administrative Occupations, are projected to decline.
3.2 Job Openings
Net employment change, as discussed earlier, is a key indicator of occupational growth, reflecting new job creation due to economic or demographic shifts. However, job openings might also arise from labor market turnover, such as when workers exit the labor force or move to different occupations. Occupational employment projections account for these openings, often revealing that separations create significantly more job opportunities than employment growth (Figure 4). For instance, despite that Office & Administrative Support Occupations are projected to lose jobs overall (Table 2), this group will remain one of the top three in annual job openings due to high turnover (Figure 4).
On average statewide, job openings from separations are almost 22 times greater than those from growth. This ratio varies widely among the occupation groups, from 5 for Healthcare Practitioners and Technical Occupations to 170 times for high-turnover Sales and Related Occupations.
The largest number of total annual openings will occur in occupations with traditionally high turnover rates or those that require minimal skills or training, including Food Preparation & Serving Related Occupations; Sales & Related Occupations; Office & Administrative Support Occupations; and Transportation & Material Moving Occupations. All of these are also among the lower-paying jobs, with median annual wages ranging from $29,050 in Food Preparation & Serving Related Occupations to $43,620 in Office and Administrative Support Occupations, all below the state median wage of $46,950 (Table 2).
3.3 Educational Attainment
In 2024, occupations requiring no formal education or only a high school diploma7 accounted for 59.6% of total employment; however, this share is projected to decline to 58.7% by 2034. The share of jobs that require an Associate's degree will increase proportionately to the number of total jobs, and will remain at the same 2.0% level.
In contrast, the share of jobs in occupations requiring education at the Bachelor’s level and beyond is expected to grow moderately through 2034 (Table 3). For instance, positions requiring a Master’s, Doctoral, or Professional degree are projected to grow the fastest.
Nonetheless, jobs that require a high school diploma or no formal education will still overwhelmingly exceed the number of jobs that require college education. While over 123,800 annual job openings are projected for those with a bachelor’s degree or higher, occupations requiring a high school diploma or no formal education will see significantly more openings – over 412,400 each year – primarily due to high transfer and exit rates (Figure 5).
Table 3. Projected Employment by BLS Educational Requirement
4. Leveraging Employment Projections for Workforce and Education Planning
Long-term employment projections provide valuable insights for guiding education and workforce planning. By identifying which industries and occupations are expected to grow or decline, schools and training providers can strategically align their programs with future labor market demands. This alignment helps ensure that students and job seekers develop relevant, in-demand skills to meet employers’ changing needs. Whether adjusting curriculum, developing career pathways, or informing funding priorities, these projections can help stakeholders build a more responsive workforce system, supporting both individuals and employers in navigating North Carolina’s evolving labor market.
To further explore LEAD’s 2034 employment projections, visit the Industry or Occupational projections data.
- 1
This report analyzes only statewide projections. Sub-state employment projection results are provided in two separate reports.
- 2
Projections assume full employment for the economy in the projected year. No major economic or political disruption is expected to occur during the projected period. Thus, the projections are not intended to be an economic forecast of future employment.
- 3
Exits: workers who leave an occupation and the labor force due to retirement or other reasons (permanently or temporarily).
- 4
Transfers: workers who leave an occupation to enter a different occupation.
- 5
BLS Employment Projections for 2024-34: https://www.bls.gov/news.release/pdf/ecopro.pdf .
- 6
Based on the North Carolina Office of State Budget and Management projections (https://www.osbm.nc.gov/demog/county-projections), the share of population aged 55 and above is expected to increase from 30.7% to 32.6% between 2024 and 2034.
- 7
Based on the BLS entry-level education requirement scale: https://www.bls.gov/emp/documentation/education/tech.htm .
This page was last modified on 04/06/2026