A previous LEAD analysis examined different occupations’ susceptibility to automation related employment disruptions, finding slightly higher shares of employment in North Carolina exposed to automation than at the national level. Generally, occupations with more physical and routine tasks are considered more exposed to automation since a machine could theoretically complete those tasks. This could lead to technology complementing the work of human laborers—allowing people to devote work time to other productive tasks and simply changing tasks within an occupation—or substitute for human labor, which might result in reallocation of labor to other occupations and industries. This piece builds on LEAD’s previous work by examining automation exposure in North Carolina at the industry level and discussing the implications for workers, policymakers, workforce and economic development leaders, and businesses.
Applying automation exposure scores to the industry level provides an idea of how technological progress could reshape labor allocations across the economy. Presumably, more automation exposure would translate into lower demand for labor in an industry, which would mean workers would either need to learn new skills to operate new technology or transition into a job that fits their current skillset and interest. Labor reallocations from automation technology played out as new machinery—among other factors—reduced manufacturing employment in North Carolina and across the country over the last few decades. New technologies streamlined production processes for production sectors such as manufacturing which contributed to employment declines, while service sector employment became more prominent.
Manufacturing, Transportation and Warehousing could face the most automation exposure
In total, there are 31 industry subsectors—or about 35 percent of North Carolina’s 3-digit NAICS industries—that face moderately high or high exposure to automation related employment disruptions.1 But firms in these industry subsectors account for only about 20 percent of total employment in the state.
Most of the industry subsectors facing higher exposure to automation are in Manufacturing and Transportation and Warehousing.2 Together, these 2-digit NAICS sectors included almost 75 percent of the 31 industry subsectors in the moderately high or high automation exposure categories. Figure 1 below shows the number of industry subsectors in the higher exposure categories organized by their larger 2-digit NAICS industrial sectors:
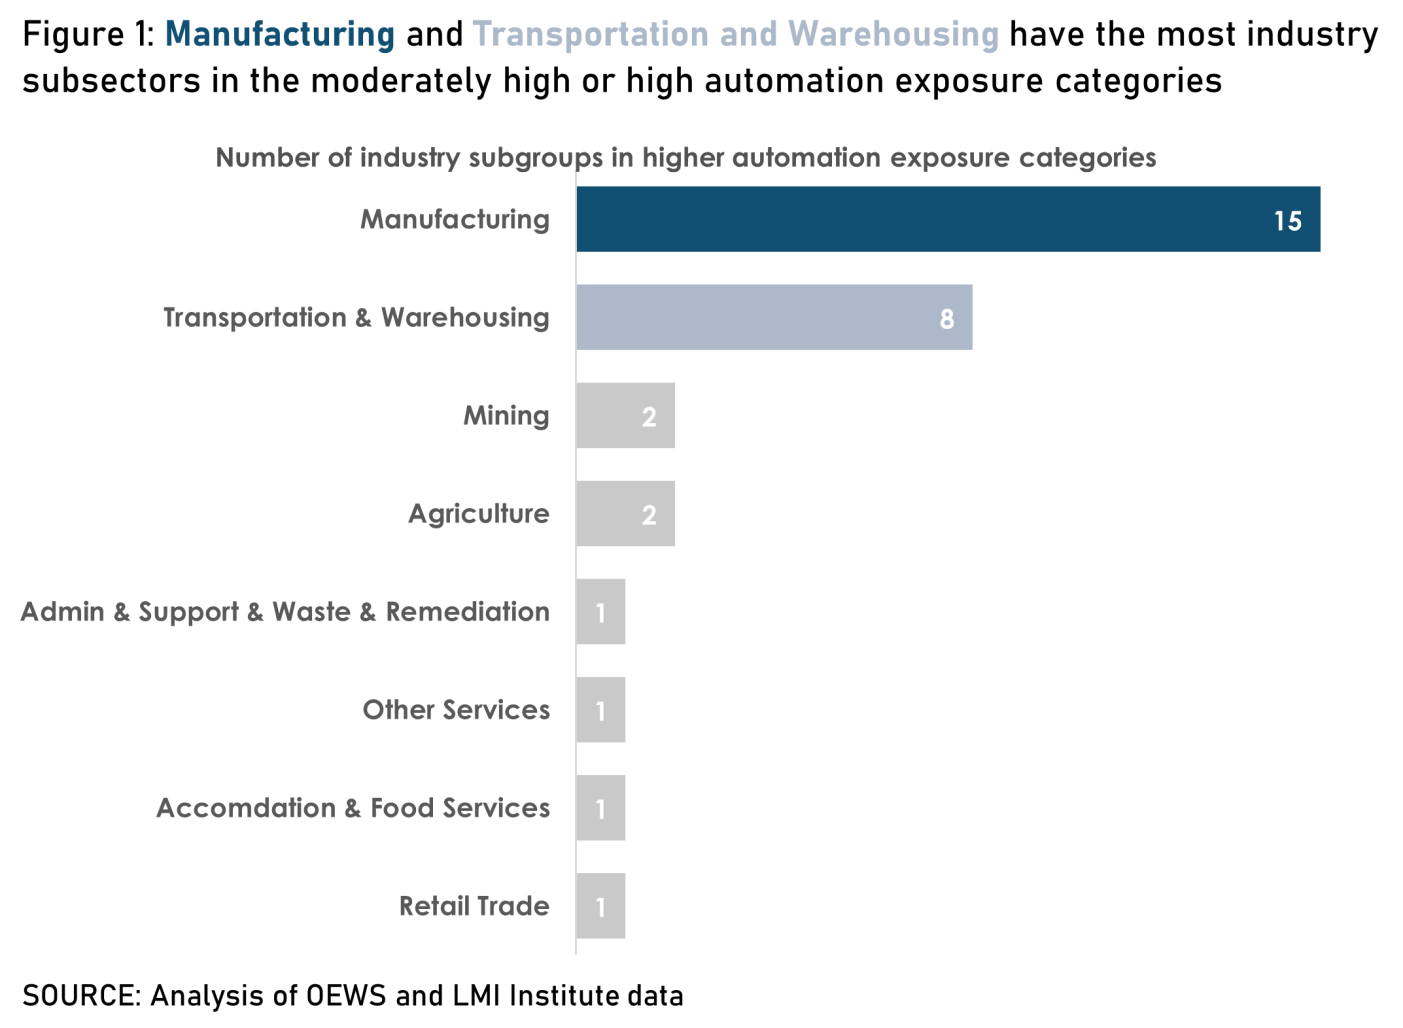
Table 1 below lists the 31 industry subsectors in the moderately high or high automation exposure categories, ordered from more exposure down to less exposure.
Textile Product Mills
| NAICS Code | Industry Subsector Title | Exposure Category | Employment | Share of Total Employment | Average Annual Wage |
|---|---|---|---|---|---|
| 491 | Postal Service | 10 | 20,320 | 0.5% | $56,740 |
| 492 | Couriers and Messengers | 9 | 31,740 | 0.7% | $43,070 |
| 113 | Forestry and Logging | 9 | 2,620 | 0.1% | $44,760 |
| 482 | Rail Transportation | 8 | 2,140 | 0.0% | $76,770 |
| 493 | Warehousing and Storage | 8 | 64,860 | 1.5% | $41,290 |
| 321 | Wood Product Mfg | 8 | 18,300 | 0.4% | $41,380 |
| 562 | Waste Management and Remediation Svcs | 8 | 12,120 | 0.3% | $44,430 |
| 484 | Truck Transportation | 8 | 48,860 | 1.1% | $50,720 |
| 314 | Textile Product Mills | 8 | 5,380 | 0.1% | $34,730 |
| 315 | Apparel Manufacturing | 8 | 5,490 | 0.1% | $32,980 |
| 313 | Textile Mills | 8 | 24,460 | 0.6% | $40,370 |
| 311 | Food Manufacturing | 8 | 56,720 | 1.3% | $38,330 |
| 213 | Support Activities for Mining | 8 | 300 | 0.0% | $70,550 |
| 326 | Plastics and Rubber Products Mfg | 8 | 34,600 | 0.8% | $46,570 |
| 332 | Fabricated Metal Product Mfg | 8 | 35,110 | 0.8% | $48,820 |
| 327 | Nonmetallic Mineral Product Mfg | 8 | 15,490 | 0.4% | $47,810 |
| 322 | Paper Manufacturing | 8 | 17,620 | 0.4% | $51,700 |
| 316 | Leather and Allied Product Mfg | 7 | 680 | 0.0% | $38,000 |
| 337 | Furniture and Related Product Mfg | 7 | 34,770 | 0.8% | $41,700 |
| 324 | Petroleum & Coal Products Mfg | 7 | 740 | 0.0% | $58,620 |
| 212 | Mining (except Oil and Gas) | 7 | 2,970 | 0.1% | $52,570 |
| 487 | Scenic and Sightseeing Transportation | 7 | 350 | 0.0% | $33,440 |
| 481 | Air Transportation | 7 | 15,990 | 0.4% | $77,880 |
| 331 | Primary Metal Mfg | 7 | 6,970 | 0.2% | $55,580 |
| 336 | Transportation Equipment Mfg | 7 | 34,120 | 0.8% | $54,720 |
| 811 | Repair and Maintenance | 7 | 42,400 | 1.0% | $42,010 |
| 722 | Food Services and Drinking Places | 7 | 351,050 | 7.9% | $25,840 |
| 115 | Agriculture and Forestry Support Activity | 7 | 3,310 | 0.1% | $38,740 |
| 485 | Transit and Ground Passenger Transportation | 7 | 5,210 | 0.1% | $38,490 |
| 447 | Gasoline Stations | 7 | 30,170 | 0.7% | $25,260 |
| 323 | Printing and Related Support Activities | 7 | 11,510 | 0.3% | $46,280 |
Industry automation exposure signals which workforces likely to change
As noted above, an industry level automation index can help signal which industries in the state are most susceptible to employment disruptions from technological progress. This can allow workforce systems, industry leaders, and policymakers to prepare for change by working with firms in exposed industries to retrain their workforce as new technology is adopted or build connections between businesses and institutions training the new types of workers they might need.
Manufacturing’s transformation provides a good example of how automation can reshape labor forces. Manufacturing employment in North Carolina has declined drastically over the last few decades for a variety of reasons, automation among them.3 At the same time, the share of workers with higher educational attainment in manufacturing increased, reflecting a growing demand for more technically trained workers. Between 1993 and 2021, the share of manufacturing workers with some college education or a bachelor’s degree noticeably increased, while the share with a high school diploma decreased (see Figure 2).
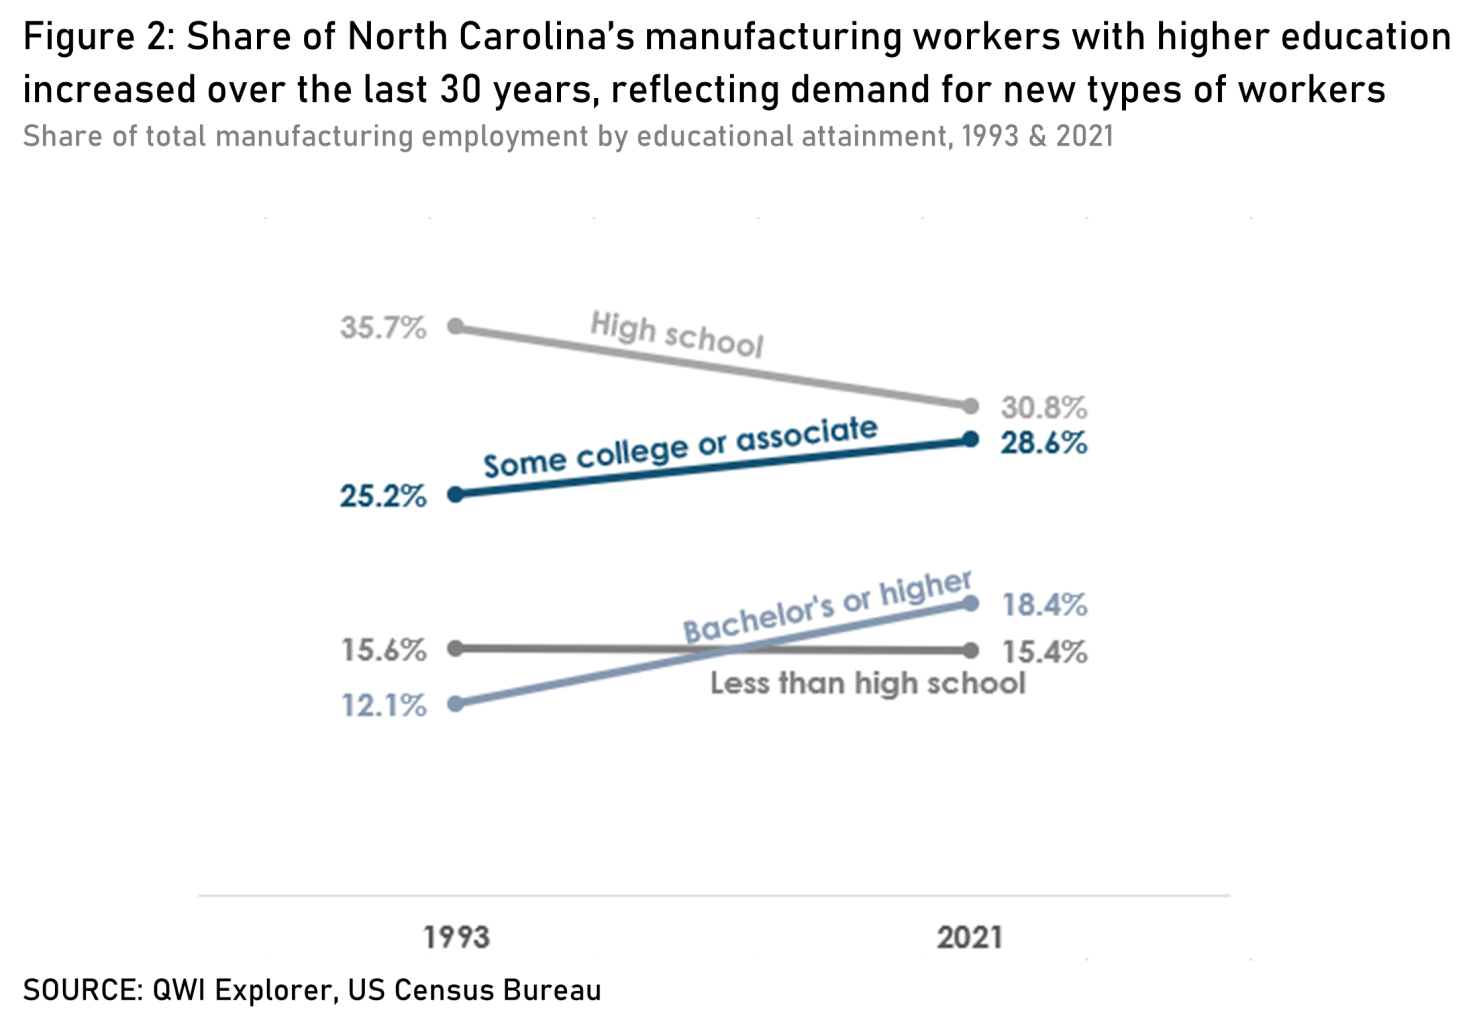
Interestingly, the share of workers with less than a high school education—who some might call “low-skilled” and are typically paid the lowest wages in an industry—remained relatively constant over the last two and half decades. This might reflect what researchers have dubbed automation’s polarizing effect. The most automatable jobs over the last few decades were typically middle-skilled jobs that paid middle class wages, such as those in manufacturing. As companies implemented automation technologies, it pushed middle skill workers toward the lower or higher ends of the skills distribution.
Recently, low wages have spared the most vulnerable workers from automation as firms have found it cheaper to pay humans than implement expensive new technologies. But recent pay increases for low wage workers and a tight labor market could make automating the lowest wage jobs more appealing in the future. This trend combined with the hollowing out of middle-class jobs could mean businesses will increasingly turn to higher educated and skilled workers who often earn more.
Workforce and education systems realize that the future of work will likely mean more demand for higher educated workers. A deeper study of potentially effected occupations can help education and training entities identify needed skills to operate and complement new technologies and plan for and shape programs and curriculum to develop them. These institutions will be critical in ensuring workers have the skills and education needed as work changes. But it is important to keep in mind that meeting future labor demands might not be as simple as retraining existing workers. If technology drastically changes the nature of a particular occupation, the work itself might not appeal to existing workers. For example, someone who enjoys working with their hands may not have an interest in learning to program a machine that now performs the same task. Therefore, businesses and industries most exposed to automation might consider building strong connections to workforce and education systems who can help them respond to evolving labor needs and build appropriate career ladders.
Automation susceptibility may not apply equally to all firms
The previously published analysis of automation exposure at the occupational level did not attempt to predict the elimination of particular jobs in North Carolina. Similarly, this industry level piece does not predict the disappearance of an industry or even mean that susceptibility will apply equally to firms within industries.
Several factors can influence the degree of susceptibility to automation employment disruptions within an industry. Human connections and interactions seem the perennial stopping force against widespread replacement of human laborers with machines. The proliferation of ATMs in the late 20th century never caused complete elimination of bank teller jobs, but instead shifted human tellers toward tasks heavier in personal interactions. Industries or firms within industries in a higher automation exposure category might find less disruption if personal interactions and connections are an important component of otherwise routine and physical occupations.
Consumer preferences could also insulate some businesses in an industry with higher automation exposure from disruption. For instance, preferences for artisan or handmade goods are not likely to disappear anytime soon. Manufacturing industries such as Furniture and Related Products Manufacturing face relatively higher exposure to automation than most industries in the state. But furniture and other manufacturers that specialize in artisan, handmade pieces might experience less disruption than firms that mass produce goods.
Applications for North Carolina
Workforce leaders: Institutions training North Carolina’s future workforce, including education systems, can use the industry level automation index to understand which industries are most susceptible to change and prepare to shape program offerings around these firms’ developing needs. As automation reshapes labor markets, these systems will also be critical in building or adjusting career ladders for occupations, such as the path from an entry level paramedic to an EMS manager.
Workers: Individuals could use industry automation susceptibility to inform employment decisions. With automation comes the potential for change and growth. While the change part can be scary for many, some may be excited about the potential for personal and professional advancement, especially if they’re interested in developing new skills. Jobseekers who value employment stability might use the industry index to find industries less exposed to automation.
Economic developers: Economic developers could use the index to identify and recruit businesses in exposed industries. Companies implementing new technology or transitioning their workforce often will need to make significant capital investments in equipment facilities and consider relocating operations as an option. Economic developers could also use automation susceptibility to identify new industry clusters with centralized supply chains, as Pittsburgh has done with its Neighborhood 91 end-to-end additive manufacturing production campus. For existing industry, knowing automation susceptibility could let economic developers proactively work with exposed firms to locate funding for new equipment.
Policymakers: Policymakers can consider policies that support the adoption of automated technologies. Such policies could take the form of funding workforce training programs that match changing needs, investing in rural broadband infrastructure, or other incentives that reduce the cost of implementing automation technologies for businesses. Industry automation exposure can tell policymakers where to focus their efforts, as Iowa has done with their Manufacturing 4.0 Initiative. With tight labor markets expected to remain, policymakers can help firms proactively prepare for changes in exposed industries while also easing current hiring challenges by reducing the demand for labor. Importantly, this should also ensure the most vulnerable workers have strong guardrails to guide them to new—and better—economic opportunities if displaced by automation.
Firms: Most business leaders are likely aware of their firms’ exposure to automation. For those that are not, this industry level automation exposure data can signal that they should prepare for change. This could mean working with current workers to retrain them for changing tasks as new technology is implemented—including finding ways to invest in further education if needed—or setting aside capital to invest in new equipment that improves efficiency.
Methodology & Data Notes
Automation exposure in this series is based on index scores calculated by the Labor Market Information (LMI) Institute, which uses occupational task and work characteristics to determine an occupation’s exposure to automation. The industry level automation exposure index presented in this article builds on the LMI Institute’s work. It fits each 3-digit NAICS industry (sometimes referred to as “industry subsectors”) into exposure categories based on the weighted sum of that industry’s occupational automation exposure scores. The weights are an occupation’s share of total industry subsector employment in the 2021 Occupational Employment and Wage Statistics (OEWS) survey from the Bureau of Labor Statistics. After calculating each industry’s index score, the distribution of scores is split into deciles by dividing the range by 10.
Due to differences in occupational classifications between O*NET and OEWS and other characteristics of the OEWS survey, the industry level automation exposure index does have some limitations. O*NET does not collect data on all occupations reported in OEWS, and, in other cases, O*NET splits occupations into more than one due to distinct differences in the types of tasks performed. Occupations listed in the OEWS data that do not have a corresponding automation index score because of absent O*NET data are not included in the weighted industry level automation exposure index.4 When O*NET data splits up OEWS occupations, the average of the sub-occupations’ automation exposure score is taken and matched to the OEWS occupation. For example, the exposure score for the Tour and Travel Guides occupation in OEWS is the average of the exposure scores for what O*NET calls “Tour Guides and Escorts” and “Travel Guides” occupations.
Other limitations of the industry level automation exposure index concern industries not accounted for in OEWS data due to slightly different industrial structures. OEWS only includes the Forestry and Logging and Agriculture and Forestry Support Activity subsectors from the larger Agriculture, Forestry, Fishing and Hunting sector. Employment in these smaller industry subsectors makes up only about 25 percent of total sectoral employment. Therefore, the automation index does not paint a complete picture of the agricultural sector’s exposure to automation, which some studies suggest could be relatively high. OEWS also excludes the Private Households industry subsector, which is absent from this analysis. Finally, OEWS does not use the same structure for the Public Administration sector as NAICS. Instead, the survey allocates jobs in this sector to the OEWS-specific federal, state, and local government sectors. These are used in place of Public Administration in the exposure index.
1Moderately high or high exposure translates to exposure categories 7 through 10.
2For readers unfamiliar with the North American Industry Classification System (NAICS), every business is placed into five different industry categories—ranging from 2-digit to 6-digit NAICS codes—with varying degrees of granularity. The more granular categories are collapsed into the broader groups as you move from 6-digit down, with the broadest category—the 2-digit NAICS code—encompassing all the detailed groupings. For example, the 2-digit NAICS code for the Retail Trade industry (44) includes nine 3-digit NAICS industry subsectors such as Health and Personal Care Stores (446) and Gasoline Stations (447).
3Globalization and an increasing number of manufacturing employers moving operations overseas also played a large part in manufacturing employment trends since the late 1990s.
4In most cases, these occupations are a relatively small share of total industry employment. Therefore, exclusion of these occupations has a minimal impact on the larger industry level score.