

Note: Figures in this post reflect U.S. Census Bureau data available at the time of publication and may differ from later releases. The latest data are available from the U.S. Census Bureau.
From Asheville to Wilmington, every North Carolina metro area gained workers on net from 2022 to 2024 through interstate job switching – workers who left a stable job in another state and landed one in an NC metro, or vice versa.1 Those gains are helping fuel the state's job growth, with North Carolina's net gain of ~75,100 workers equal to about a quarter of the ~295,000 jobs it added.2 Of that net gain, 93% came from beyond NC's four neighboring states, led among metro areas by New York.3
This post follows our earlier statewide findings using data from the NC Interstate Worker Flows Dashboard. Here, we look at those flows by metro area using the dashboard's Metro Profile. Metro-level results can help workforce boards, councils of government, economic developers, and others see which places and industries their region draws workers from, detail that statewide totals do not show.
Charlotte and Raleigh-Cary Gained the Most Workers
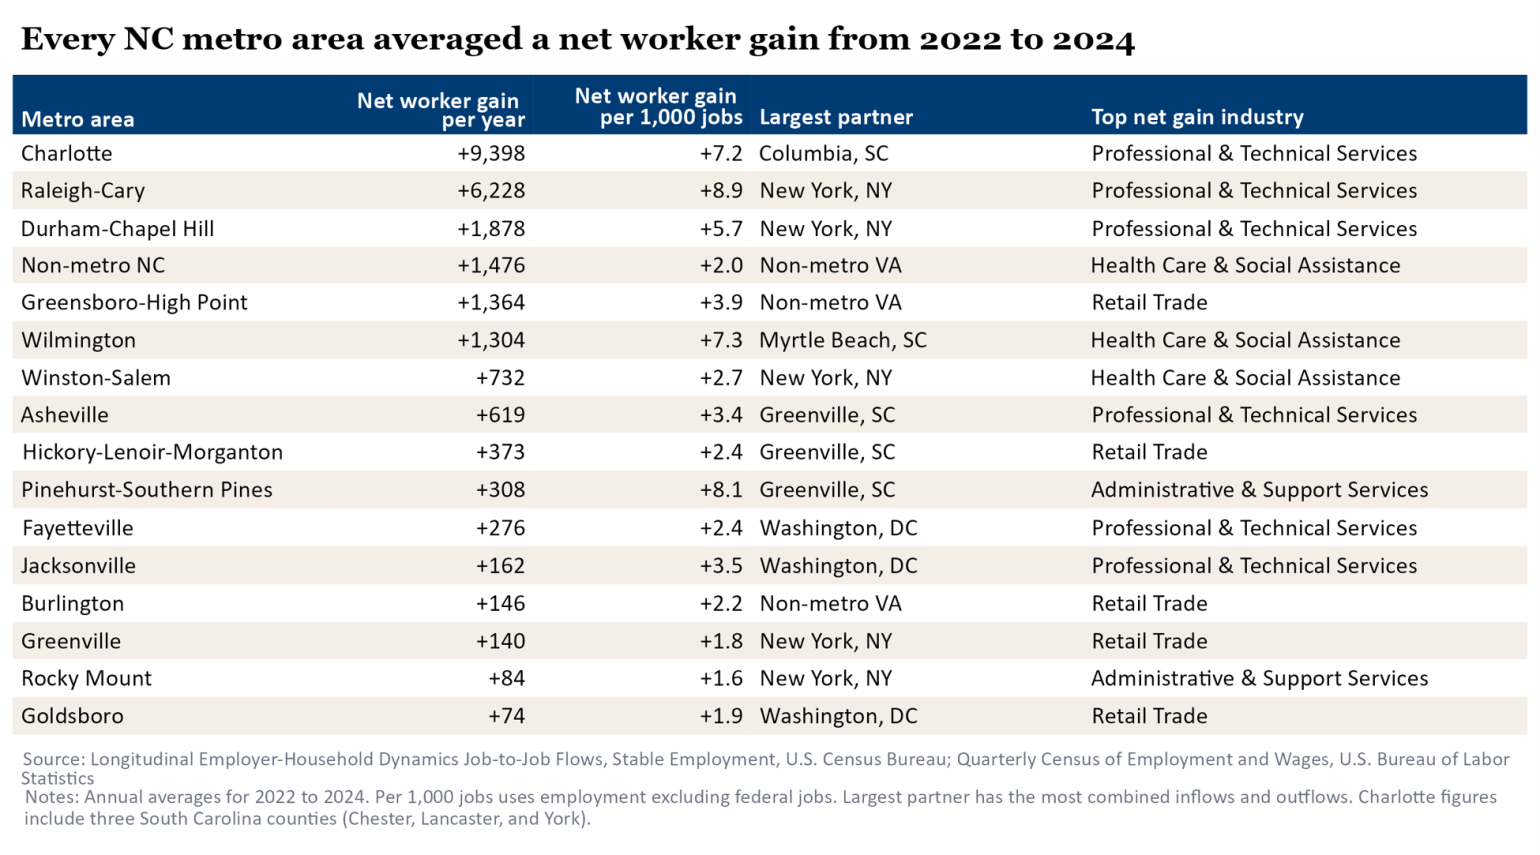
In absolute terms, Charlotte averaged a net gain of ~9,400 workers a year from 2022 to 2024, the largest of any NC metro area, followed by Raleigh-Cary at ~6,200. Larger metros have more workers to trade, so Table 1 also shows net worker gain per 1,000 local jobs. On that basis, Raleigh-Cary led with an average of 8.9 per 1,000 jobs, followed by Pinehurst-Southern Pines (8.1), Wilmington (7.3), and Charlotte (7.2).
Across all NC metro areas, Professional & Technical Services had the largest net gain of any industry from 2022 to 2024 (~14,800), followed by Health Care & Social Assistance (~10,300). Professional & Technical Services was also the top net gain industry in the most areas (6), while Retail Trade led in 5, mostly smaller metros.
Table 1
Nearly All of the Net Gain Came From Beyond Neighboring States
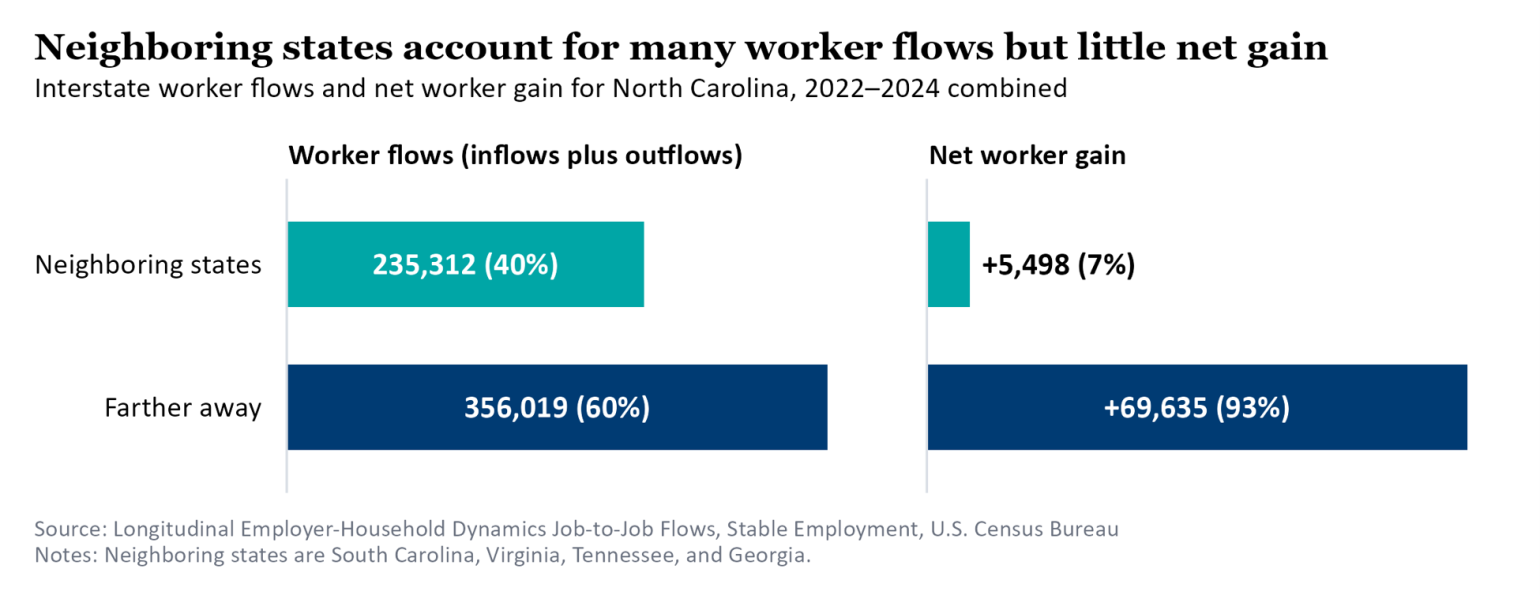
Worker flows with neighboring states were large but mostly balanced out. From 2022 to 2024, South Carolina, Virginia, Tennessee, and Georgia accounted for 40% of North Carolina's ~591,000 interstate worker flows (inflows plus outflows), but only 7% of its net worker gain (Figure 1).
Figure 1
New York Sent the Most Workers
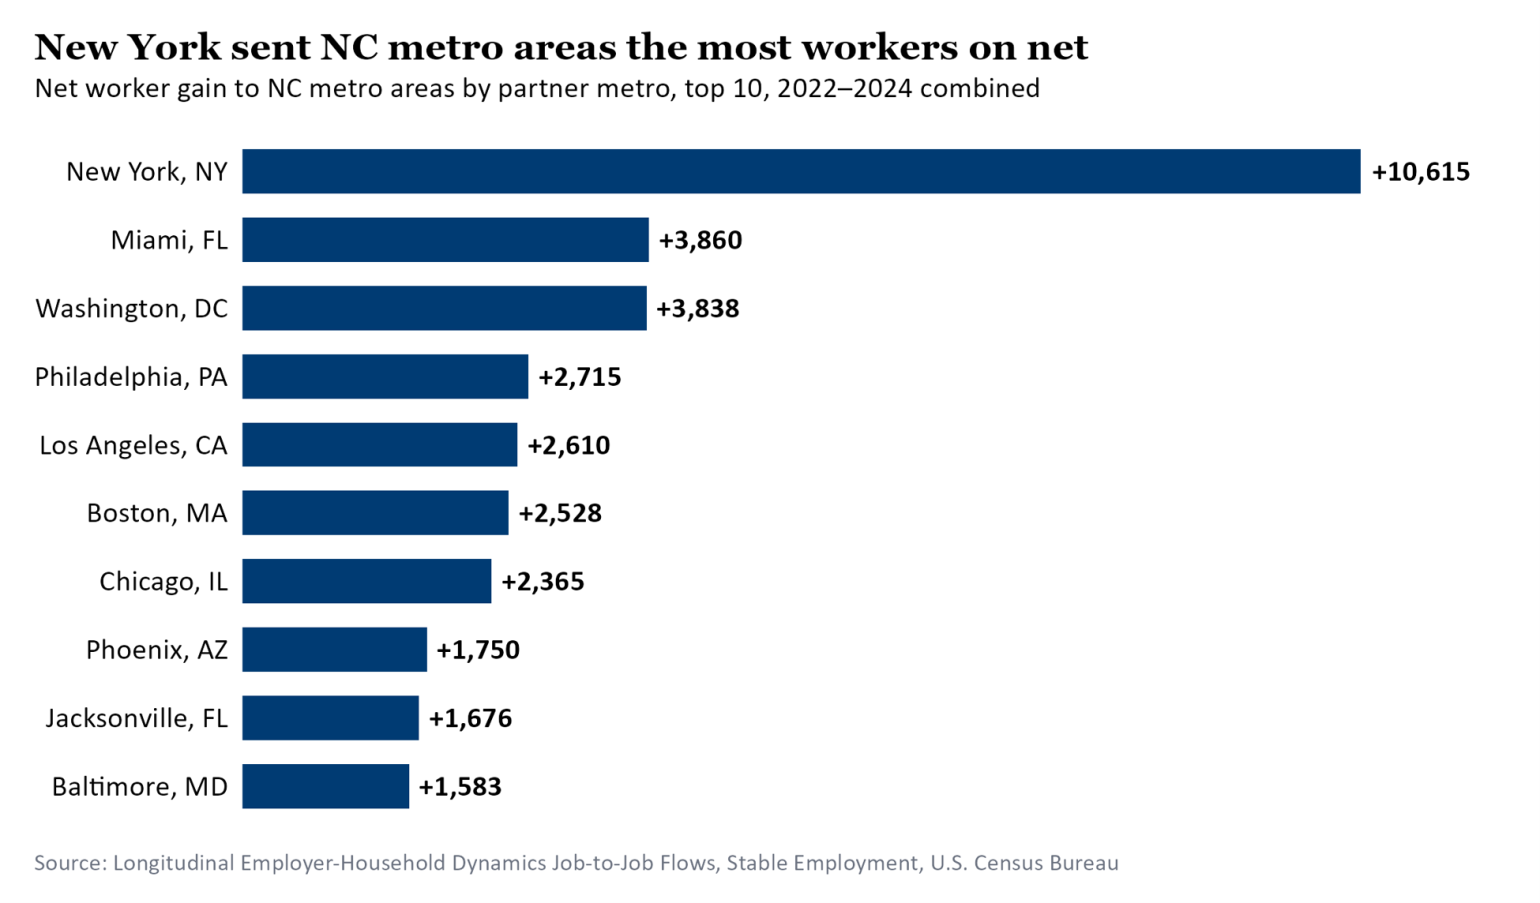
New York stood out among partner metros, adding a net ~10,600 workers to NC metro areas from 2022 to 2024, about 14% of the total net gain. Miami and Washington, D.C. followed with ~3,900 and ~3,800, with all three adding workers on net to every NC metro area. Together, the top 10 partner metros, including Philadelphia, Los Angeles, and Boston, accounted for 46% of the net gain (Figure 2).
Figure 2
Explore the Data
Curious how your metro fared? The Metro Profile in the NC Interstate Worker Flows Dashboard at lead.nc.gov/J2J reports flows, partner metros, and industry detail for every NC metro area back to 2001. The full dataset used for this analysis is available through the dashboard's Download button. Employment and wage data for NC metro areas, including the QCEW figures used here, are available through LEAD's D4 data tool at d4.nccommerce.com. For more labor market data and analysis, visit LEAD at lead.nc.gov.
- 1
Data are from the U.S. Census Bureau's Longitudinal Employer-Household Dynamics (LEHD) Job-to-Job Flows, Stable Employment series, as published in the NC Interstate Worker Flows Dashboard. A worker is counted when they switch from a stable job (earnings in three consecutive quarters) at one employer to a stable job at another. Flows are based on where the job is located rather than where the worker lives, and exclude federal employees, military personnel, and the self-employed. Some small flows are suppressed to protect worker privacy, and a partner's flows are included only when all four quarters of the year are available. Virginia Beach-Chesapeake-Norfolk is excluded from the metro-level analysis due to insufficient North Carolina employment.
- 2
Jobs added is the change in non-federal Quarterly Census of Employment and Wages (QCEW) employment from December 2021 to December 2024.
- 3
Some metro area names are shortened to their largest principal city. A full list of metro areas and their counties is available from the U.S. Census Bureau.