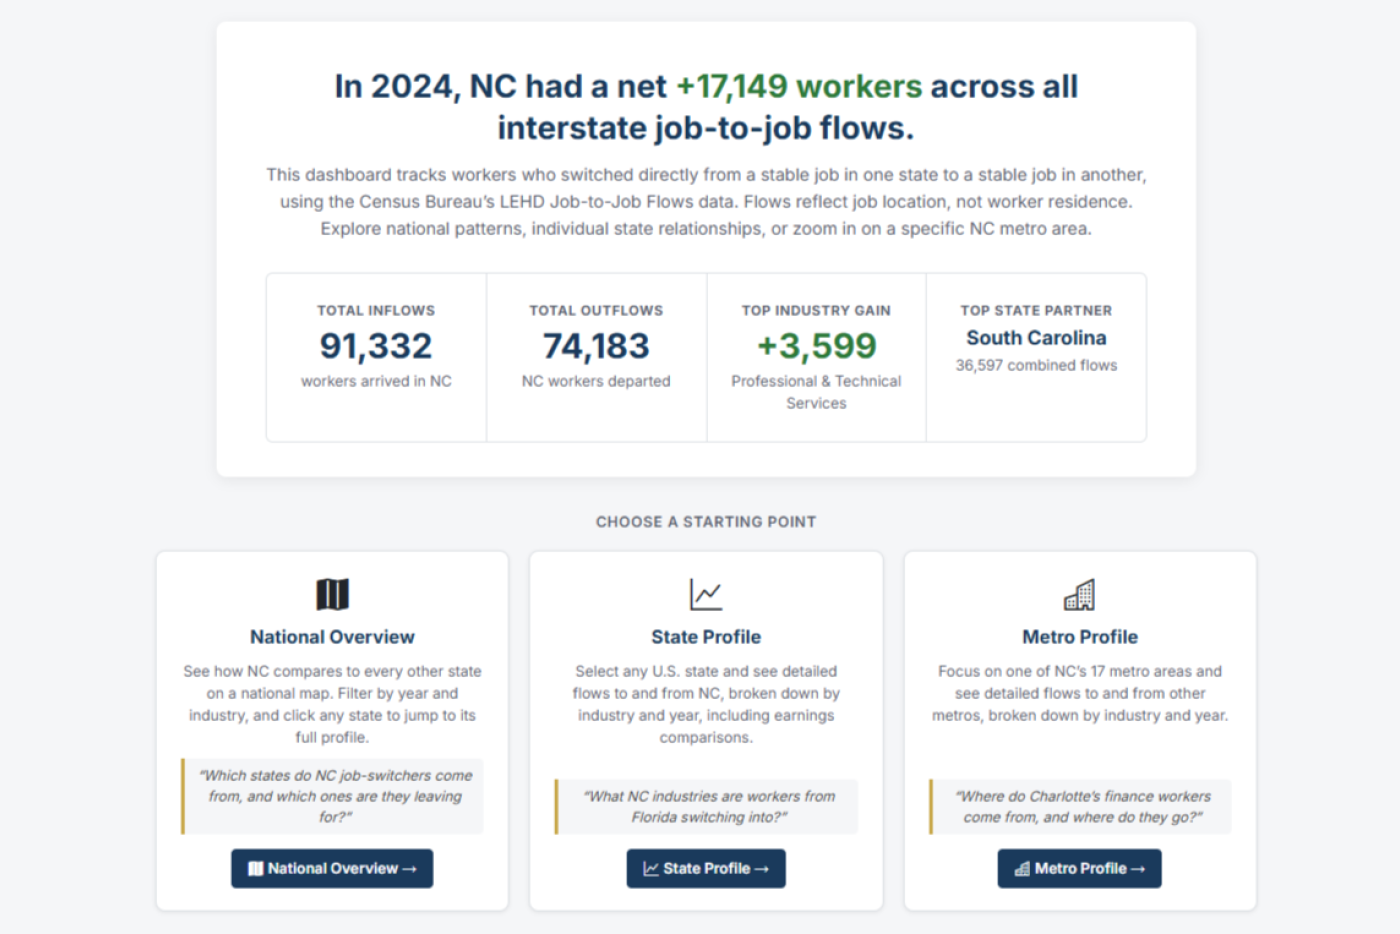
North Carolina gained more than 310,000 workers from other states than it lost since 2001, measured by interstate job switching — workers who left a stable job elsewhere and landed one in NC, or vice versa. That advantage held in 2024, when the state attracted over 17,000 more workers than it lost.
NC has posted a net worker gain every year on record
In 2024, 91,000 workers arrived in North Carolina from jobs in other states, while 74,000 NC workers departed. Both inflows and outflows have grown substantially over two decades, but inflows have consistently outpaced outflows — leaving NC with a positive net balance in every year the data covers.
Figure 1 — NC Worker Flows Over Time, All States, 2001–2024
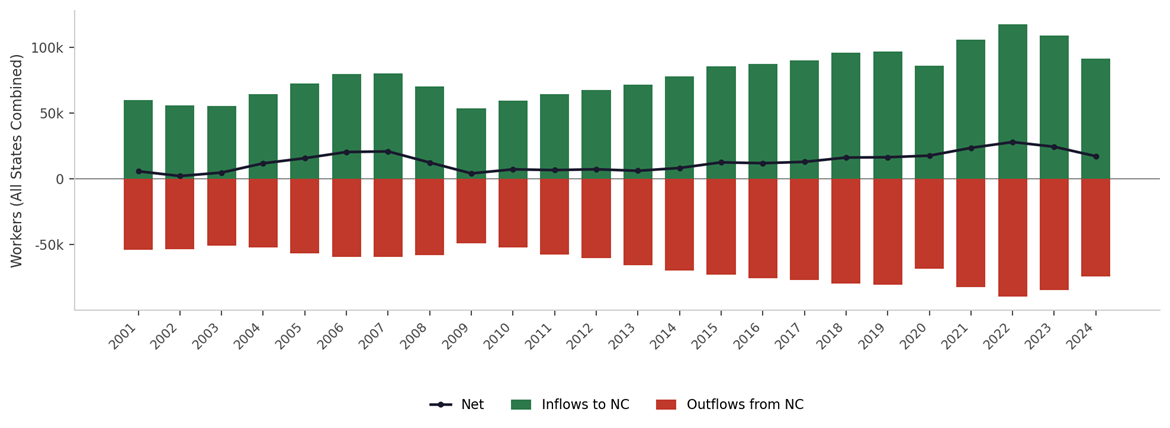
Source: Longitudinal Employer-Household Dynamics Job-to-Job Flows, Stable Employment, U.S. Census Bureau | 2001–2024
Workers arriving in NC in 2024 earned an average of nearly $3,800 more per year at their new NC job than at their prior job (+4.5%). Workers leaving NC saw larger gains on average — almost $9,500 more per year (+12.4%) — reflecting that some outflow represents workers pursuing higher-paying opportunities elsewhere. NC remains a net importer of talent despite that gap, likely in part due to NC’s lower cost of living relative to its top labor partners.1
Professional & Technical Services led all sectors; only three industries posted net losses
Seventeen of NC’s twenty tracked industries posted net worker gains in 2024. Professional & Technical Services led with a net gain of 3,600 workers, followed by Health Care & Social Assistance (+3,000) and Finance & Insurance (+2,770). Only three sectors ended the year in the red: Agriculture, Forestry & Fishing (-54), Accommodation & Food Services (-249), and Management of Companies (-288).
Table 1 — Net Worker Flows by Industry, NC, 2024
| Industry | Inflows | Outflows | Net |
|---|---|---|---|
| Professional & Technical Services | 11,129 | 7,530 | +3,599 |
| Health Care & Social Assistance | 11,301 | 8,238 | +3,063 |
| Finance & Insurance | 6,700 | 3,928 | +2,772 |
| Administrative & Support Services | 8,501 | 7,004 | +1,497 |
| Wholesale Trade | 4,869 | 3,419 | +1,450 |
| Retail Trade | 8,982 | 7,857 | +1,125 |
| Transportation & Warehousing | 4,808 | 3,784 | +1,024 |
| Construction | 6,709 | 5,977 | +732 |
| Information | 2,521 | 1,936 | +585 |
| Manufacturing | 5,723 | 5,295 | +428 |
| Public Administration | 1,438 | 1,020 | +418 |
| Real Estate & Leasing | 1,538 | 1,236 | +302 |
| Other Services | 2,003 | 1,713 | +290 |
| Arts, Entertainment & Recreation | 1,746 | 1,524 | +222 |
| Educational Services | 4,791 | 4,647 | +144 |
| Mining & Oil/Gas Extraction | 96 | 63 | +33 |
| Utilities | 220 | 199 | +21 |
| Agriculture, Forestry, Fishing | 243 | 297 | -54 |
| Accommodation & Food Services | 6,283 | 6,532 | -249 |
| Management of Companies | 1,575 | 1,863 | -288 |
Source: Longitudinal Employer-Household Dynamics Job-to-Job Flows, Stable Employment, U.S. Census Bureau | 2024
NC posted net gains against most states — South Carolina was the only exception
New York was NC’s largest net source in 2024 (+2,500), followed by California (+1,900), New Jersey (+1,500), Virginia (+1,450), and Pennsylvania (+1,100). South Carolina was the only state where NC finished with a net loss, sending 400 more workers south than it received.
Table 2 — NC Net Worker Flows by State, Top 5 Gains and Only Loss, 2024
| State | Net Workers |
|---|---|
| New York | +2,518 |
| California | +1,938 |
| New Jersey | +1,529 |
| Virginia | +1,450 |
| Pennsylvania | +1,107 |
| South Carolina | -399 |
Source: Longitudinal Employer-Household Dynamics Job-to-Job Flows, Stable Employment, U.S. Census Bureau | 2024
Explore the full dashboard
If a company is weighing a North Carolina location and wants to know whether the state can attract workers in their industry and what wage changes those workers are seeing, or a workforce board wants to understand which metro areas are drawing in the most talent for a given sector, the NC Interstate Worker Flows Dashboard can help answer those questions directly. Filter by state, metro area, industry, and year to drill into the flows behind the headline numbers. [Link to NC Interstate Worker Flows Dashboard]
About the data
The dashboard uses the Longitudinal Employer-Household Dynamics Job-to-Job Flows, Stable Employment series from the U.S. Census Bureau. A flow is counted only when a worker held a stable job — defined as earnings in three consecutive quarters — at both their origin and destination employer. This requirement excludes brief, seasonal, or transitional employment and counts only ongoing job relationships. All industry and geographic attribution reflect the NC-side establishment. Federal employees, military personnel, and the self-employed are not covered by the underlying data. Some small industry flows are suppressed by the Census Bureau to protect worker privacy.