Last month, LEAD introduced the County Economic Vitality Index — a composite measure of the economy for all 100 North Carolina counties. Scores are benchmarked annually against the U.S. average across unemployment, wages, median household income, and educational attainment. We also shared 10 key findings from the data revealing patterns in NC's economic geography.
Today, we're making it easier to explore those patterns yourself through the County EVI interactive dashboard.
What's in the dashboard
The dashboard is organized into four components, each designed to answer a different question about NC's economic geography:
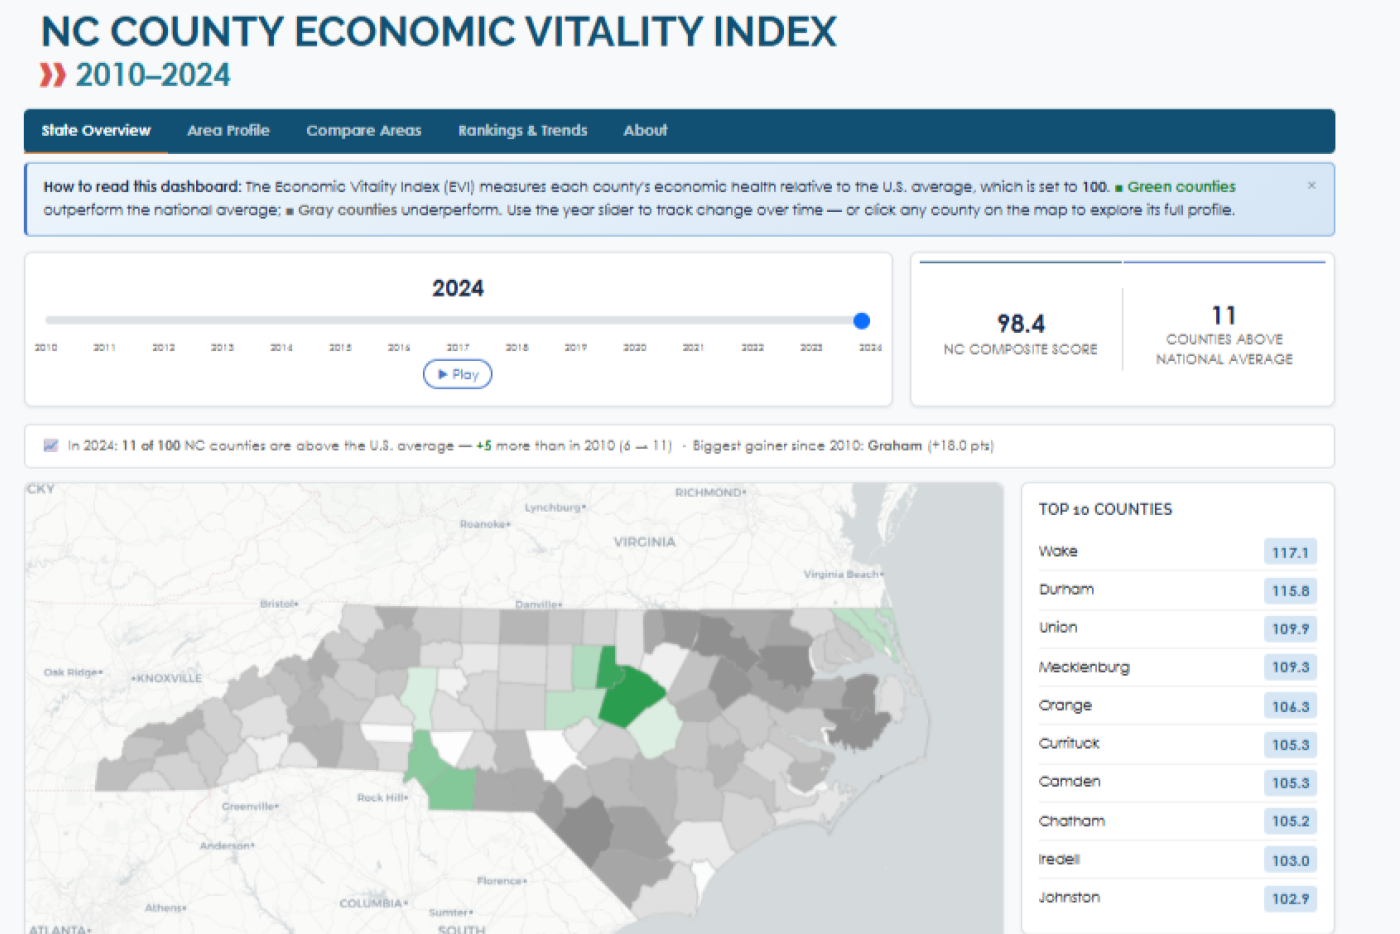
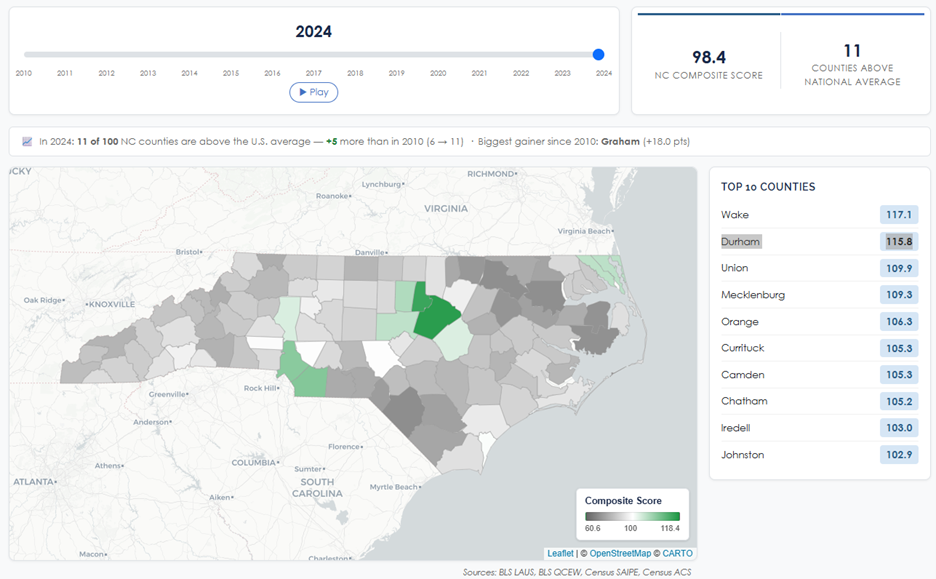
- State Overview — A statewide map showing each county's composite EVI score years 2010 through 2024. Blue counties reflect those outperforming the national average and orange counties falling below it. A year slider lets you animate changes over time, and top and bottom county rankings update dynamically.
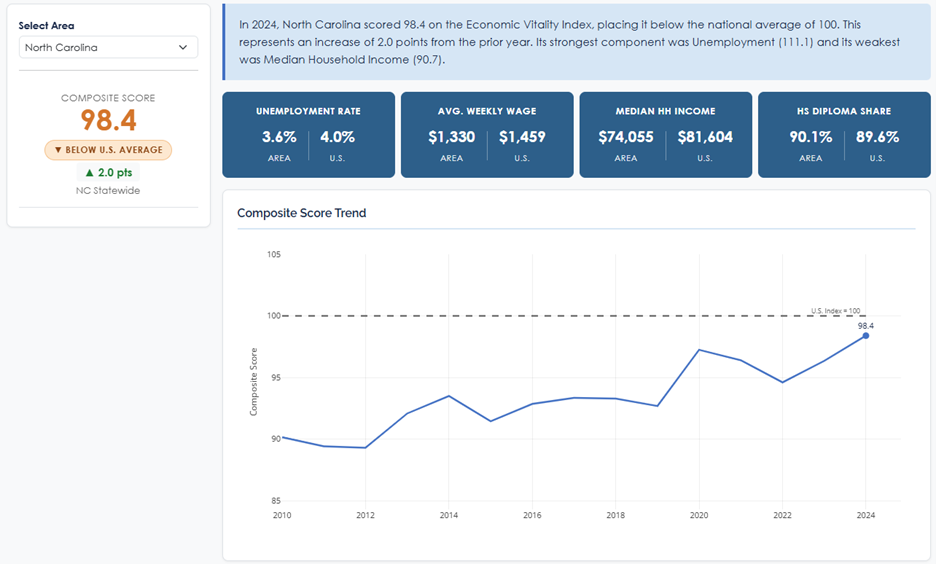
- Area Profile — Click any county from the statewide map (or select from a dropdown) to see 2024 data for the area and U.S., plus trend graphs for its composite score and unemployment, wage, income, and education indices. This should illustrate the components driving the overall score and their trends.
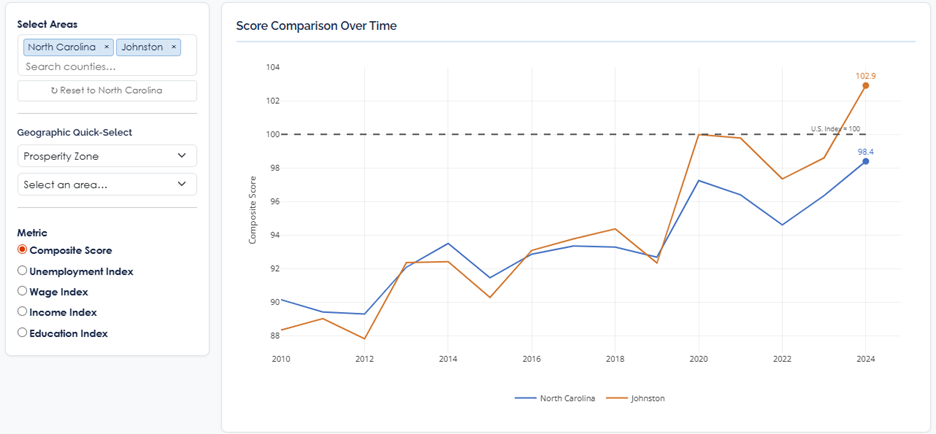
- Compare Areas — Select multiple counties or geographies side by side and compare any metric across years. Useful for understanding how peer counties or regions (Prosperity Zones, Councils of Government, Workforce Development Boards, urban-rural counties) stack up.
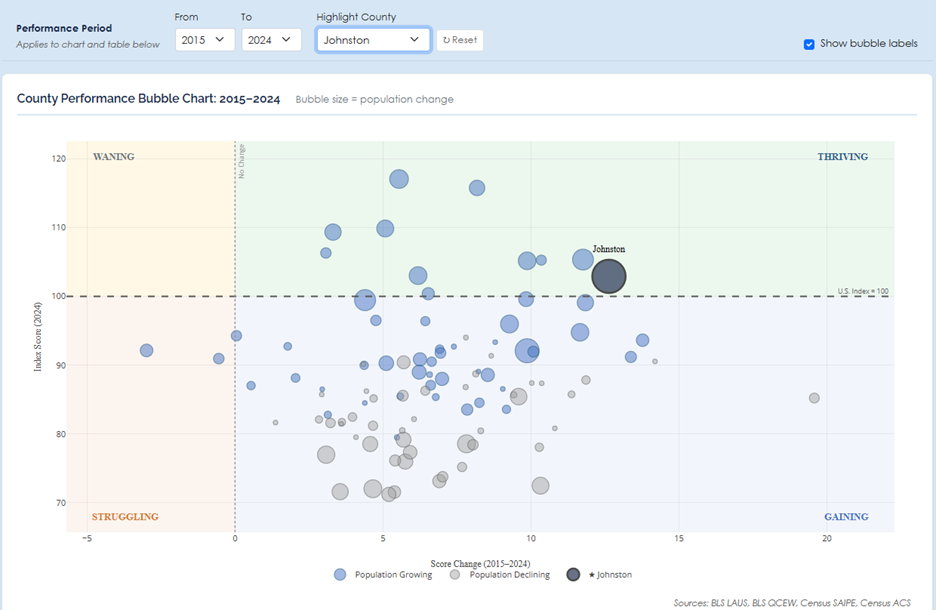
- Rankings & Trends — A sortable full-county ranking table, a performance bubble chart (score vs. change, with population growth as bubble size), and a "Most Improved" view highlighting counties making the biggest gains over a user-defined period.
Why it's useful
The dashboard is designed for a broad audience — economic developers, local officials, researchers, and curious residents alike. Because every county score is benchmarked to the same national standard, you can make meaningful comparisons across counties. A county's current score tells you where it stands, but scores across 15 years reveal trends and how local conditions are improving or weakening compared to national norms.
Explore the dashboard at analytics.nccommerce.com/economic-vitality-index and watch for future articles highlighting key insights from this data.