To better understand the local economic performance in North Carolina, and how that performance has changed over time, LEAD developed an index to measure the economic outcomes across the 100 counties. Four factors—median household income, average wage, unemployment rate, and educational attainment—are compared to U.S. benchmarks, averaged to create a composite score, and tracked over 15 years. A score above 100 is better than the U.S. and a score below is lower than the U.S. In 2024 (the latest data available) North Carolina scored 98.4, meaning 1.6% lower than the nation. This was the highest score since at least 2010.
Details about the index, its selection criteria, and its relationship to other community economic outcomes (population, business establishment, and employment growth) are described in detail in a companion post.
The Index can tell us a lot about local and regional economic growth and contributing factors. Here are 10 high level initial insights impacting our view of North Carolina.
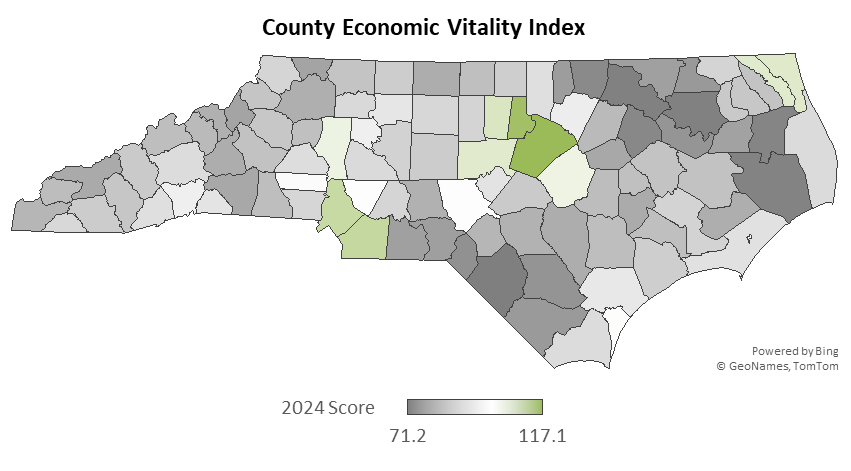
High scoring counties are dominated in and around major metros.
- 11 N.C. counties outperformed the U.S. in 2024, mainly in the Triangle, Charlotte, and Virginia Beach metros
- Seven counties are quickly closing in on the U.S. score – Moore, Cabarrus, Lincoln, Henderson, Davie, Franklin, and Pender
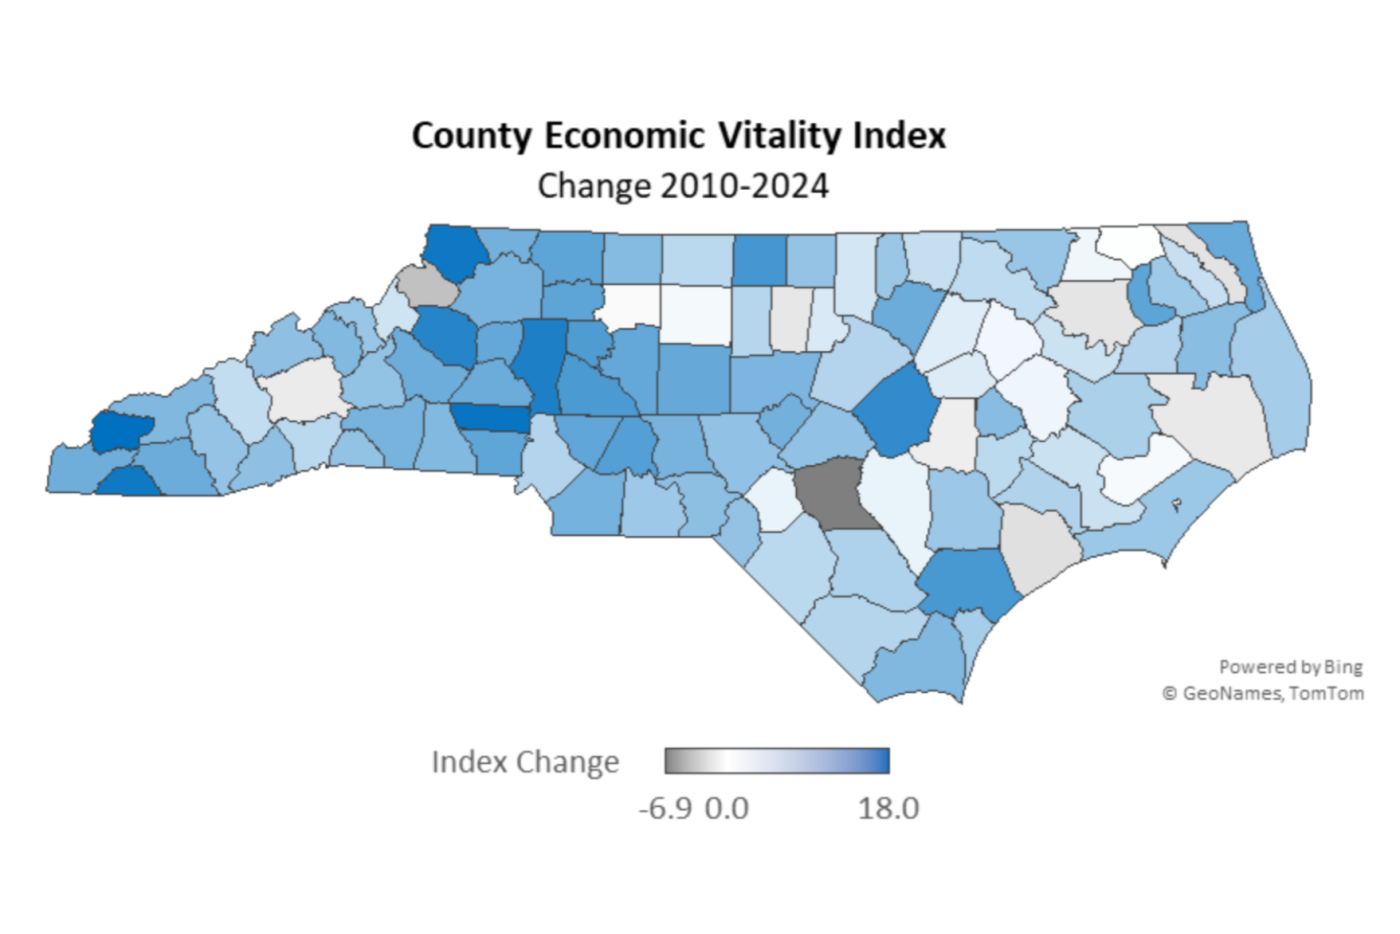
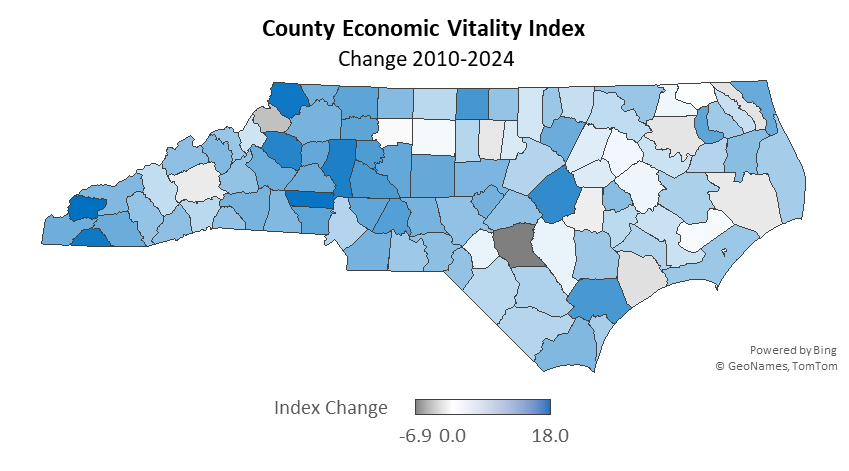
Improvement is widespread across the state.
- 90 NC counties strengthened faster than the U.S. since 2010
The bubble chart below positions North Carolina and its counties based on current performance and long-term change in the Index:
- Vertical axis: County Index score in 2024 (higher values indicate stronger performance relative to the U.S.)
- Horizontal axis: Change in Index score from 2010 to 2024 (movement to the right indicates improvement over time)
- Bubble size and color: Population change from 2010 to 2024;
- Blue bubbles indicate population growth; gray bubbles indicate population decline
- Larger bubbles represent larger population changes
Counties fall into four quadrants based on performance in 2024 and trend since 2010:
- Thriving (upper right): Outperformed the U.S. and have improved
- Waning (upper left): Outperformed the U.S. but have declined
- Gaining (lower right): Underperformed the U.S. but have
- Struggling (lower left): Underperformed the U.S. and have declined

- High scoring counties increased population - 28 of the top 29 counties (those with Index scores above .915 in 2024) increased in population from 2010-2024
- Low scoring counties decreased in population – the 30 lowest who scored below .825 in 2024 declined from 2010-2024
Conditions are very uneven.
- NC’s suburbs and rural western NC are improving particularly fast
- Several of NC’s mid-size metros are barely keeping up or falling behind the U.S. – Fayetteville, the Triad, Goldsboro, Rocky Mount, Greenville
The Index reveals single-year changes, including Hurricane Helene’s impact.
- Eight counties in Western NC had the largest single year decline with Buncombe showing the steepest drop (falling below its 2010 score) from 2023 to 2024
The Index uncovers root causes.
- Lower unemployment rates and higher high school attainment have been the most significant contributors to most counties’ improvement
- Wage and incomes weigh heavily on lower county performance
Taken together, these findings suggest that North Carolina's economic improvement has been broad but uneven. Much of the improvement across counties has been driven by tightening labor market and increasing high school graduation. At the same time, persistent gaps in wages and household income continue to constrain performance in many rural and smaller metro counties. Understanding both the sources of recent gains and the barriers to further progress will be essential for shaping policies that sustain growth and expand economic opportunity statewide. Future articles will explore these dynamics in depth.
