

Note: Figures in this post reflect U.S. Bureau of Labor Statistics and U.S. Census Bureau data available at the time of publication and may differ from later releases.
As we await the release of new U.S. Census data in the next month or two that will enable an update of the NC County Economic Vitality Index, let's look back at what drove North Carolina's growth from 2010 and what held some counties back. North Carolina's composite score on the Index rose from 90.5 in 2010 to 97.6 in 2024 (its highest in the 15 years the Index covers), and 88 of the state's 100 counties strengthened faster than the U.S. However, those gains do not show whether the gap between each year's highest- and lowest-scoring counties is closing, which matters when deciding where to focus economic development efforts. This post looks at the gap between the 10 highest-scoring counties (the top 10) and the 10 lowest-scoring counties (the bottom 10) in each year from 2010 to 2024.1
Key Findings
- Both groups' average composite scores rose by similar amounts (4.0 and 5.3 points), so the gap between them held steady. It stayed between 33 and 39 points in every year from 2010 to 2024.
- Education was the only component where the bottom 10 closed in on the top 10, and that gap narrowed from 15.6 points to 8.8.
- However, the income gap widened by 9.0 points, the most of any component, which more than offset the narrower education gap.
- Unlike education and income, wages and unemployment moved similarly in both groups. Wage scores fell slightly (about 3 points), while unemployment scores improved considerably (15 to 18 points), so neither changed the gap much.
- The top 10 counties were home to about a third of North Carolinians in 2024, and the bottom 10 to about 3%.
The Labor and Economic Analysis Division (LEAD) of the NC Department of Commerce developed the Index to compare each county with the U.S. on four components: the unemployment rate, private-sector average weekly wage, median household income, and the share of residents age 25 and older with a high school diploma or higher. A score of 100 equals the U.S. average, and the composite score averages the four components (see the Index methodology for details).
The Top 10 and Bottom 10 Counties Gained by Similar Amounts
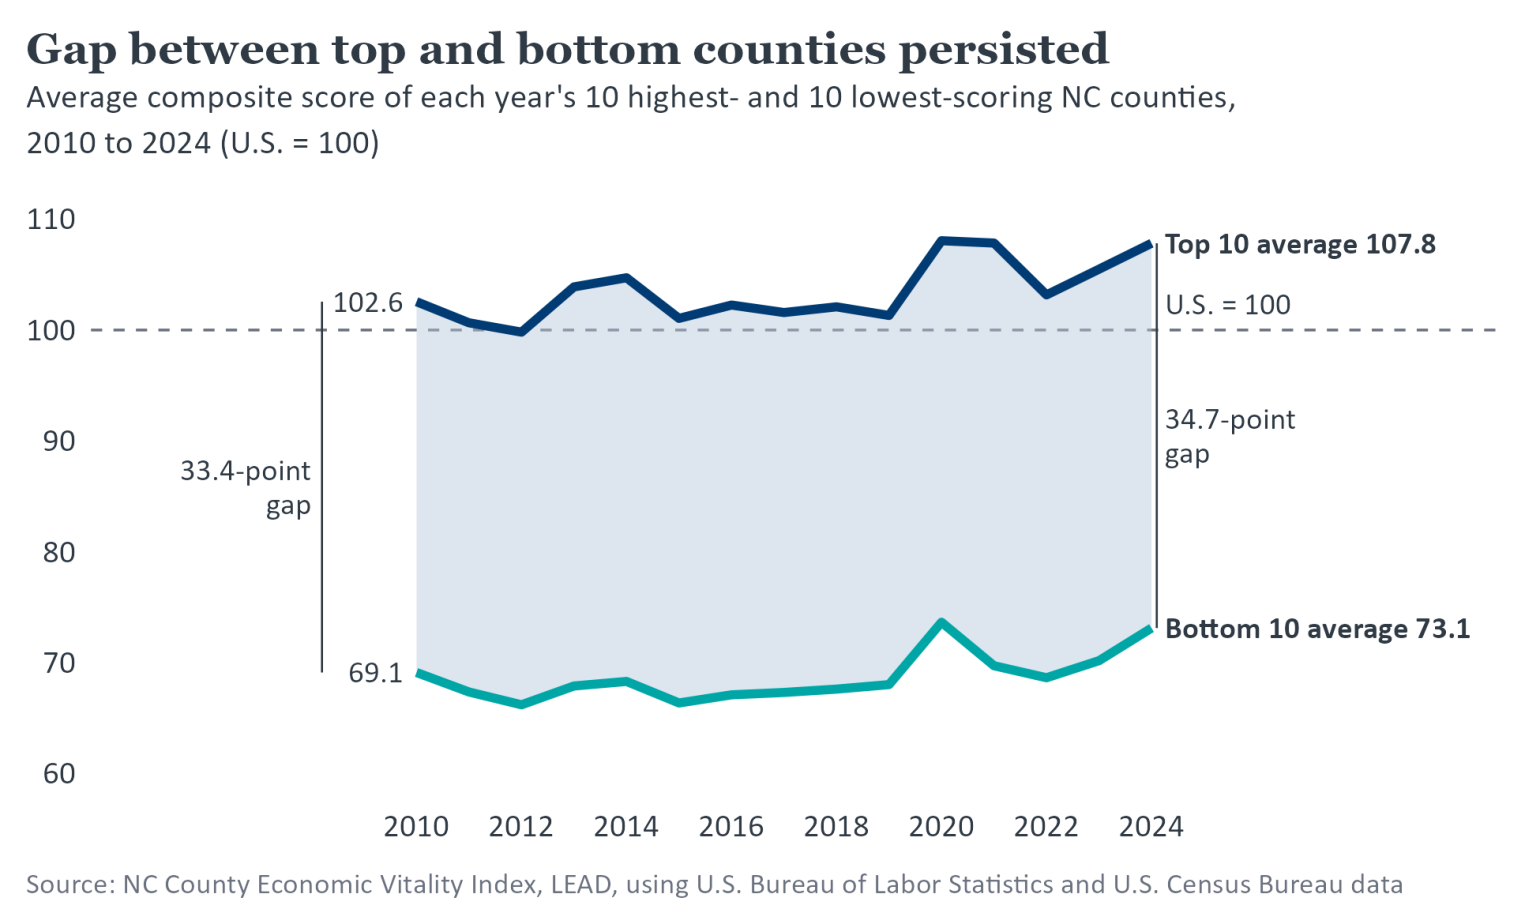
The top 10's average composite score rose 5.3 points, from 102.6 in 2010 to 107.8 in 2024 (about 8% above the U.S.). The bottom 10's average rose 4.0 points, from 69.1 to 73.1 (about 27% below the U.S.). As a result, the gap between the two groups changed little, from 33.4 points in 2010 to 34.7 in 2024, and it stayed between 33 and 39 points in every year in between (Figure 1).
Many of the same counties stayed at each end of the rankings as well. Eight of the 10 highest-scoring counties in 2010, including Wake, Durham, and Mecklenburg, were still in the top 10 in 2024. In the bottom 10, six counties appeared in both years: Bladen, Halifax, Robeson, Scotland, Tyrrell, and Warren.
Figure 1
Education Converged, Income Diverged, and Wage and Unemployment Gaps Held Steady
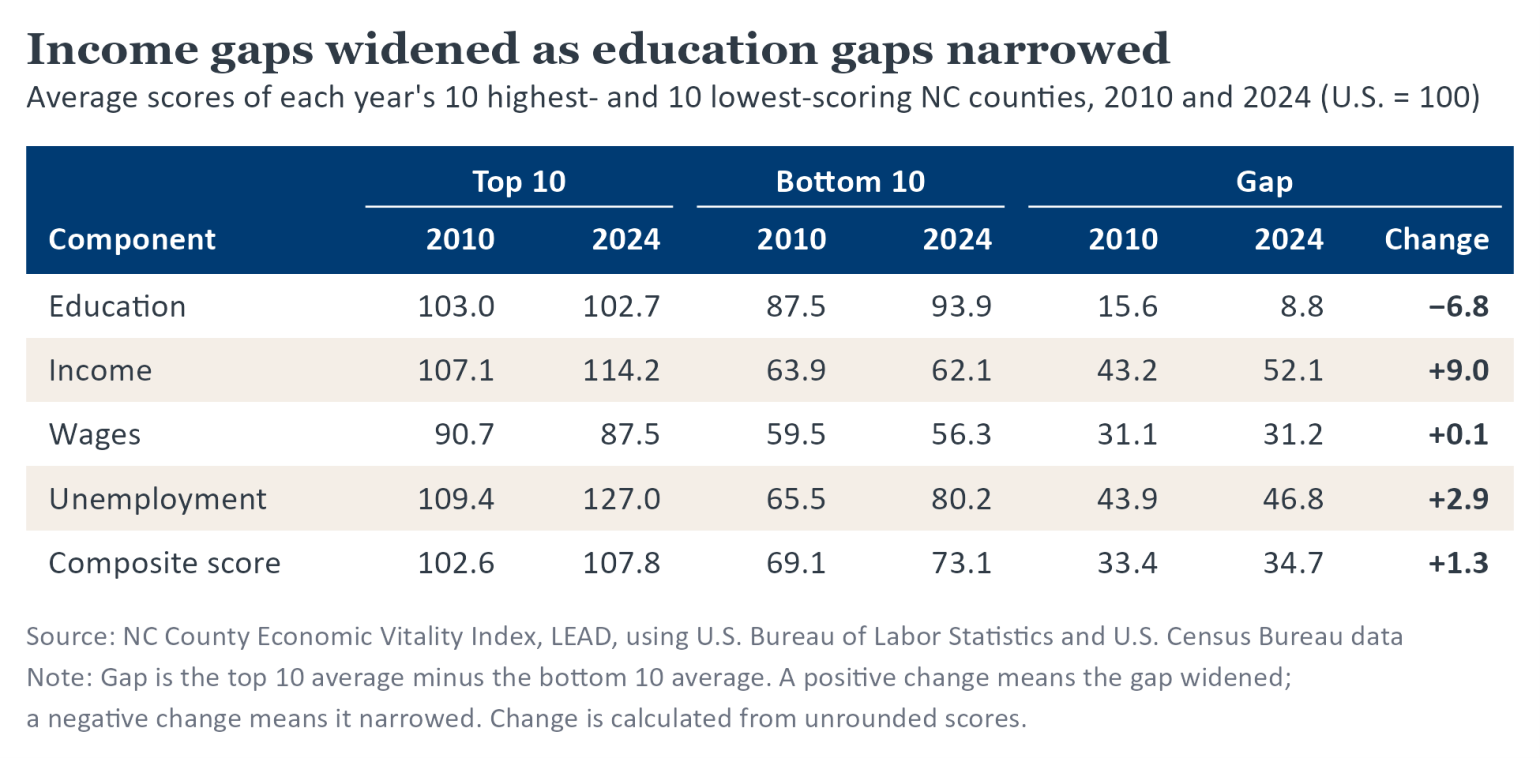
The education gap narrowed by 6.8 points, from 15.6 in 2010 to 8.8 in 2024 (Table 1). Part of that follows from how the measure works. The share of residents with a high school diploma or higher cannot exceed 100%, so the bottom 10 had more room to grow. In addition, as the U.S. share rises, high-scoring counties have less room to stay above it. For example, Wake's share rose from 91.6% to 94.0%, but its score fell from 107.8 to 104.9.
In contrast, the income gap widened by 9.0 points, from 43.2 to 52.1, as the top 10's average income score rose and the bottom 10's fell slightly. While most of the counties in the top 10 in 2010 remained in the top 10 in 2024 and saw their scores increase, a change in the group's composition also widened the gap. Johnston and Iredell, two counties with higher income scores than the ones they replaced, joined the top 10 between 2010 and 2024. Looking at both measures, because each component counts for a quarter of the composite score, the wider income gap more than offset the narrower education gap, adding about half a point to the gap in the composite score.
Unlike education and income, wage scores fell by similar amounts in both groups (about 3 points), so the wage gap barely changed. Why household income and wages moved differently may be explained in part by what each component measures. The wage component counts pay per private-sector job located in a county, while household income counts earnings and other cash income received by households living in the county, wherever that income was earned. Among other possibilities, income can grow while wage scores slip if non-wage income, such as dividends, grew faster than wages. Income can also grow without lifting wages in the county if an increasing share of residents commuted to higher-paying jobs elsewhere, such as in Wake and Mecklenburg. Each would widen the income gap as well, to the extent it lifted incomes more in the top 10 than in the bottom 10.
Unemployment scores rose 15 to 18 points in both groups, the largest gain of any component and the source of most of each group's improvement in composite score. Because the two groups gained by similar amounts, however, the unemployment gap changed little as well. Together, wages and unemployment added less than 1 point to the gap in the composite score.
Table 1
A Third of North Carolinians Live in the 10 Highest-Scoring Counties
While many counties score well below the 10 highest-scoring counties, North Carolina's residents are not equally distributed among counties. In 2024, the 10 highest-scoring counties were home to about 3.6 million people, roughly a third of the state's residents, while the 10 lowest-scoring counties accounted for about 3%. In fact, the 10 highest-scoring counties had about as many residents as the 63 lowest-scoring counties combined.2 This also explains why North Carolina's 2024 composite score of 97.6 is much closer to the top 10 average (107.8) than to the bottom 10 average (73.1). The score is calculated from statewide figures, such as the state's unemployment rate and median household income, so more populous counties have more influence on it.
Explore the Data
Curious how your county fared? The NC County Economic Vitality Index at lead.nc.gov/economic-vitality-index reports composite and component scores and statewide ranks for every NC county from 2010 to 2024. For more labor market data and analysis, visit LEAD at lead.nc.gov.
- 1
For each year from 2010 to 2024, the 10 highest- and 10 lowest-scoring counties are selected by composite score, so the counties in each group can change. Group scores for Education, Income, Wages, Unemployment, and Composite score are simple averages across those counties, so each county counts equally. The gap is the top 10 average minus the bottom 10 average in each year.
- 2
Population figures are U.S. Census Bureau American Community Survey (ACS) five-year estimates for 2024.