

Over the past two decades, a smaller share of bachelor’s-level Education1 graduates have entered the Educational Services sector, according to data from the Common Follow-up System (CFS). Between 2004 and 2024, both first-year employment and longer-term employment in the sector declined, signaling a meaningful shift in the post-graduation career pathways for Education majors. This article examines the trend in Education bachelor’s degree graduates from UNC system schools working in the sector over time.
First-Year Employment Trends
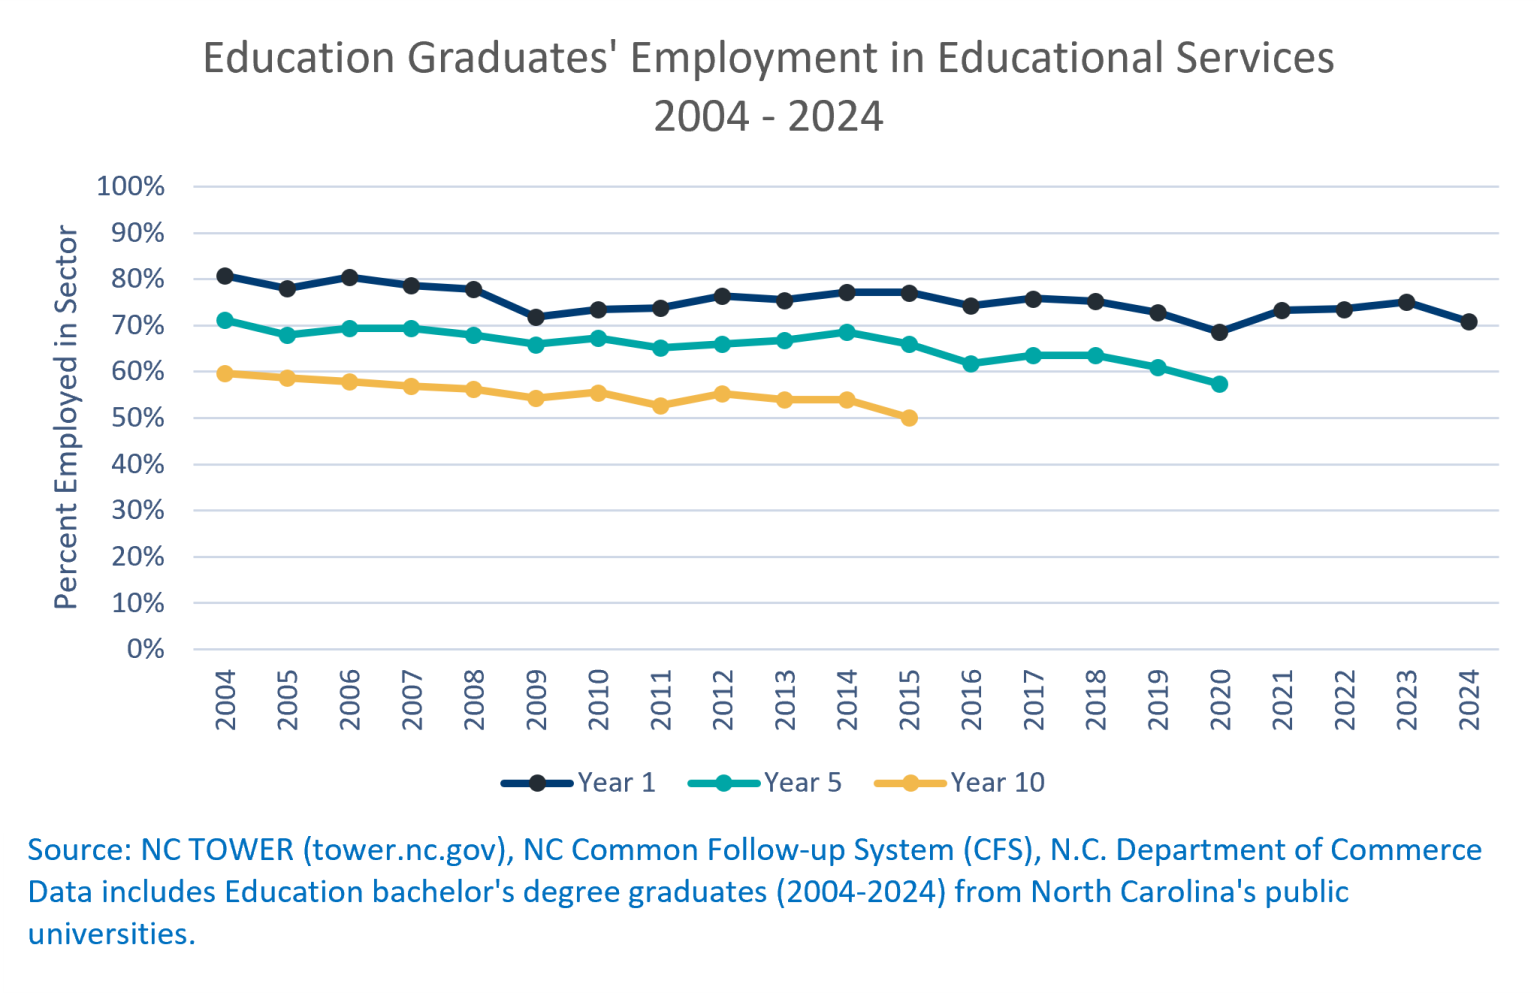
First-year employment in the Educational Services sector peaked with the 2004 graduating cohort, when 81 percent of graduates secured roles in the field. In contrast, 69 percent of the 2020 cohort entered the sector within their first year following graduation. There was a slight rebound from 2021 to 2023, but the rate declined again to 71 percent in 2024. On average across the 20-year period, approximately three out of four Education graduates began their careers in Educational Services.
Five-Year Employment Trends
Five-year employment rates show an even more pronounced decline. Among the 2004 cohort, 71 percent were employed in the sector five years after graduation. For the 2020 cohort, this figure fell to 57 percent. This indicates that, while most Education graduates entered the Educational Services field upon graduation, a smaller share worked in the sector after five years.
Ten-Year Employment Trends
Longer-term trends show a gradual decline in the ten-year employment as well. Sixty percent of the 2004 cohort were employed in the Educational Services sector a decade after graduation. For the 2015 cohort, only half were employed in the field ten years later. This suggests long-term persistence in the sector has weakened over time.
Impact of Economic Downturns
Economic disruptions appear to have amplified these patterns. Graduates entering the labor market during the 2009 recession and the 2020 pandemic experienced noticeably lower initial employment and reduced long-term employment in the Educational Services sector. Sector employment rates for these cohorts did not rebound in the subsequent years, indicating that graduates did not return to the Educational Services sector when employment conditions were more favorable.
Figure 1
Education Graduates’ Employment in Educational Services
Wages Remained Flat
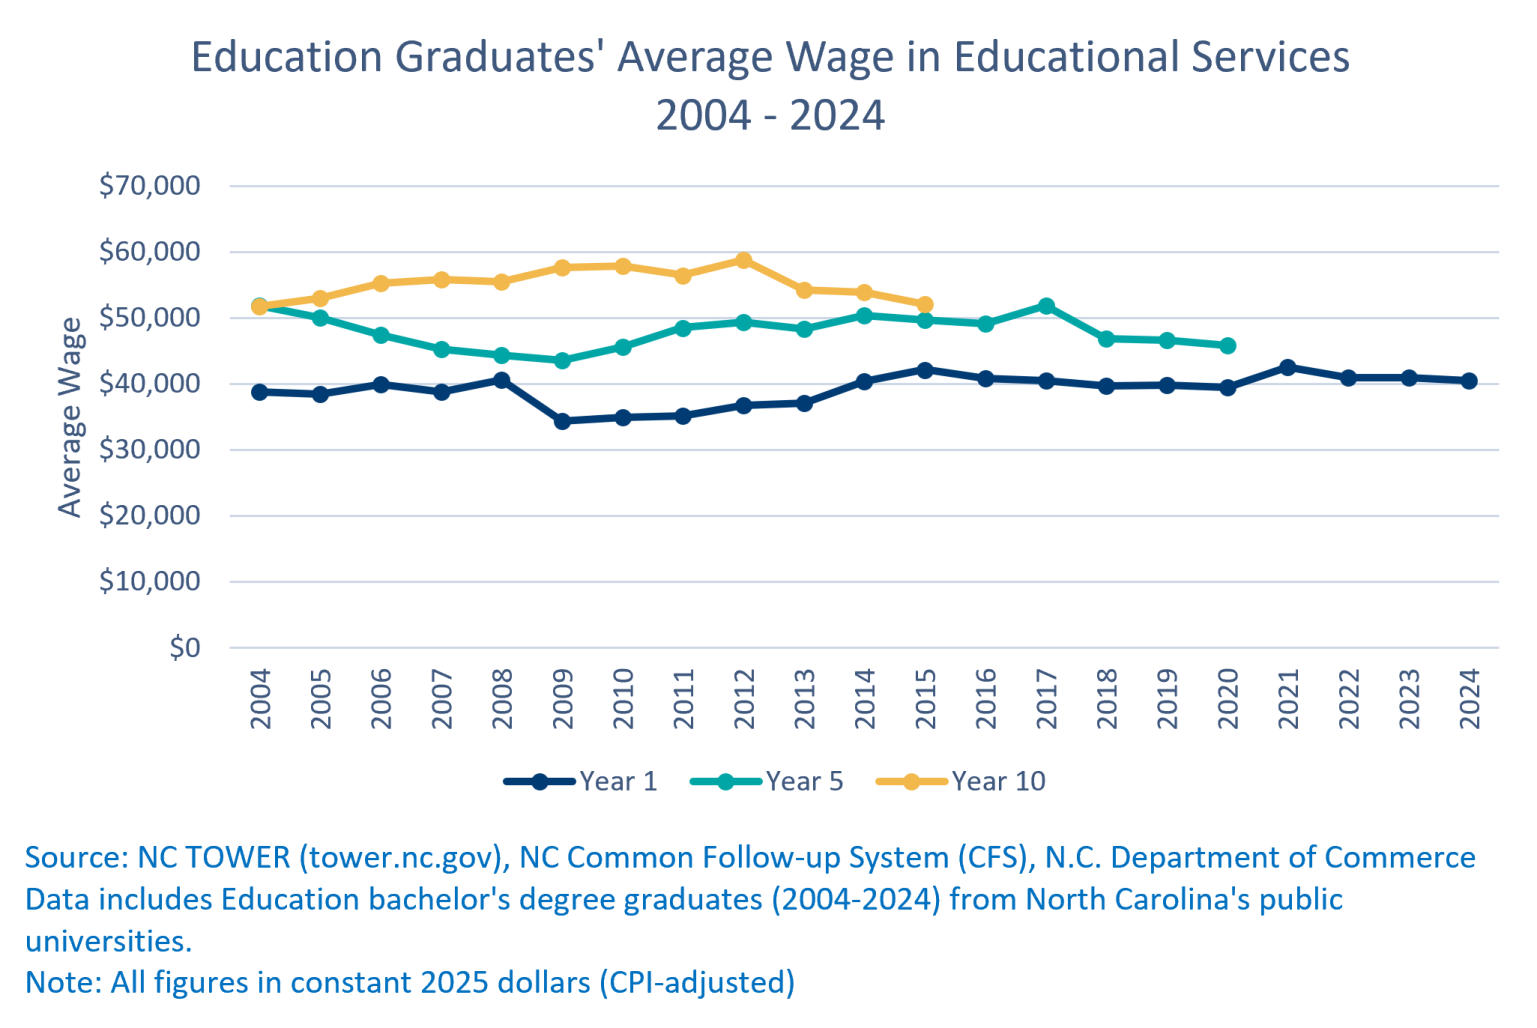
Average wage earnings2 for Education graduates working in Education Services sector remained relatively flat over time after adjusting for inflation. Wages for new graduates declined for the 2009 cohort but recovered by the mid-2010s and remained stable. Similarly, wages for graduates five years after graduation dipped for the recession cohorts but increased to a high of about $52,000 for the 2017 cohort before declining again. Average wages ten years after graduation increased to about $59,000 for the 2012 cohort before declining to about $52,000 for the 2015 cohort.
Figure 2
Education Graduates’ Average Wage in Education Services
Growth in Graduate Enrollment
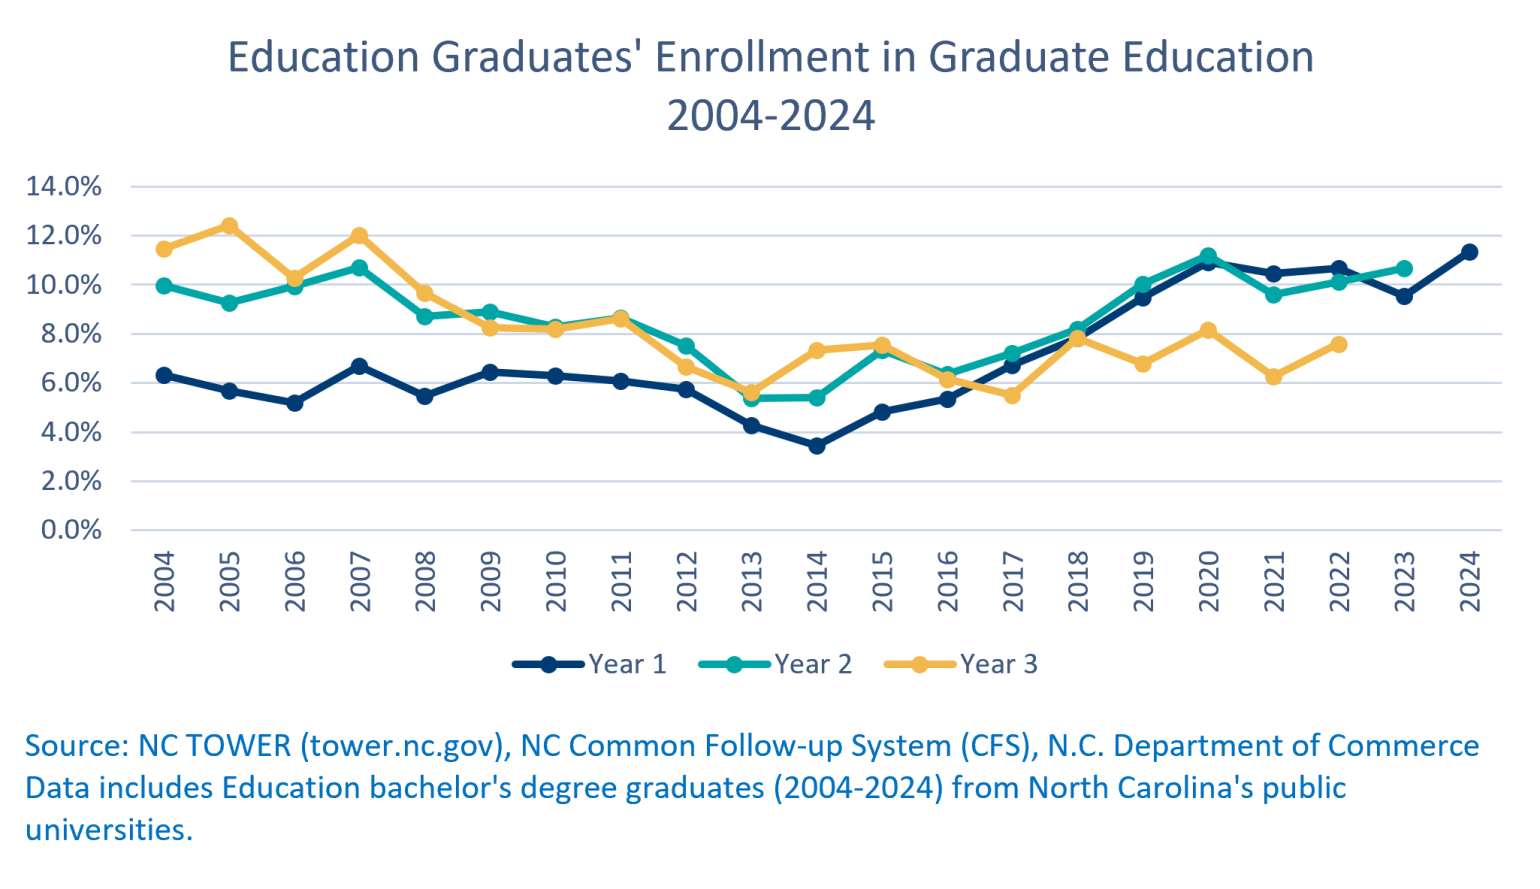
Enrollment in master's and doctoral programs immediately following graduation nearly doubled, rising from roughly six percent for the 2004 cohort to eleven percent for the 2024 cohort. Enrollment during the third year after graduation declined over time, indicating that more recent graduates enrolled in graduate programs right away rather than after a few years in the workforce.
Figure 3
Education Graduates’ Enrollment in Graduate Education
Implications for North Carolina
Across two decades of graduating cohorts, Education graduates have become less likely to enter the Educational Services sector, and those who do are less likely to be employed in the sector five or ten years later. Economic disruptions, wage trends, and shifting graduate enrollment patterns provide important context, although the data do not establish why sector employment has declined. These findings can help inform workforce planning and efforts to strengthen North Carolina’s education labor pipeline.